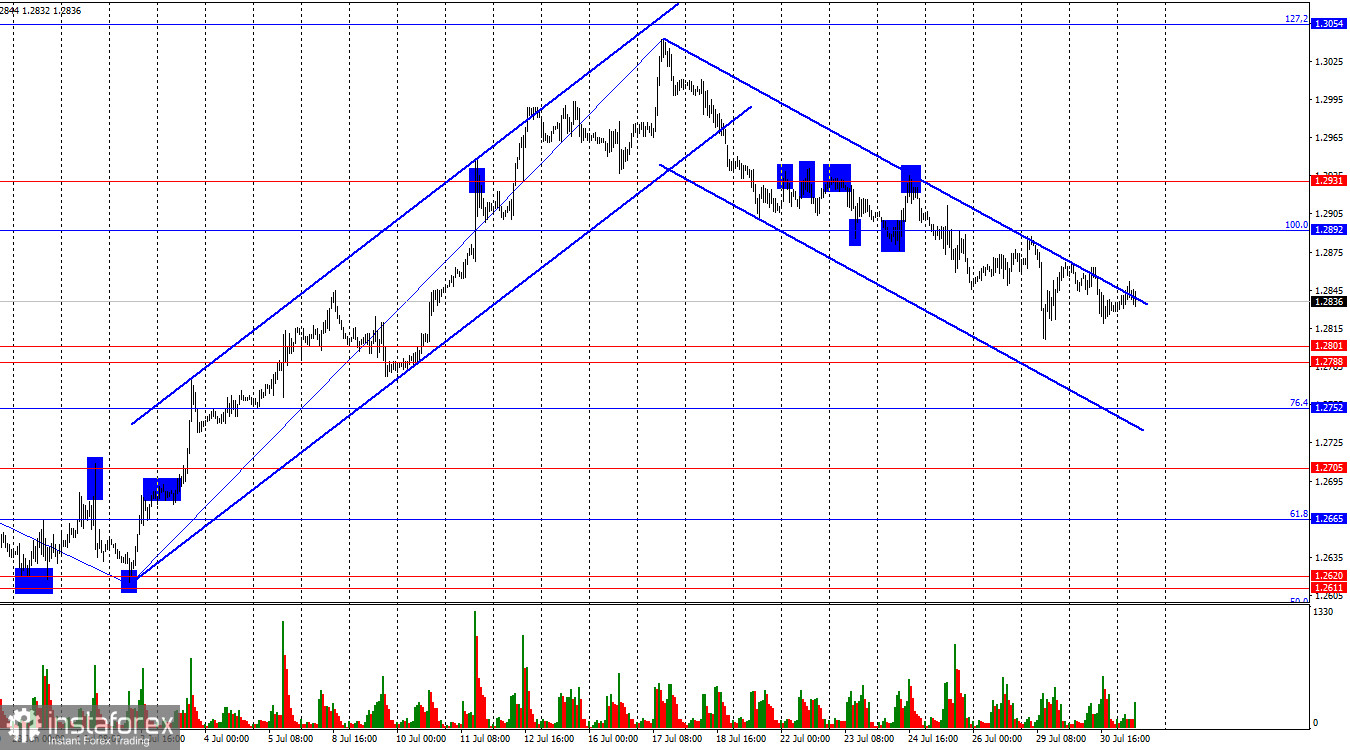
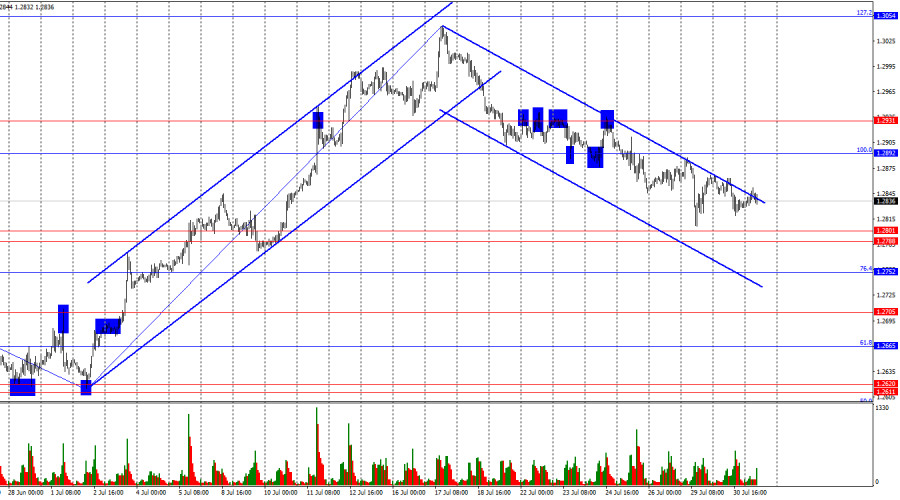
On Tuesday, the GBP/USD pair traded indecisively on the hourly chart, unsure of which direction to move. A rebound from the support zone of 1.2788–1.2801 could allow traders to anticipate some growth towards the 100.0% corrective level at 1.2892. Securing the quotes above the downward trend channel will not signify the end of the "bearish" impulse. Trader activity remains low, and any movement takes more time than usual.
The wave situation has changed somewhat. The last completed downward wave (which began forming on June 12) managed to break the low of the previous downward wave, and the last upward wave broke the peak of the previous upward wave. Thus, we are currently dealing with a "bullish" trend. The pound's rise may continue, but traders are forming a corrective downward wave. There is no talk of a trend change to "bearish" yet in terms of wave analysis. For this to happen, the pair must break the last low from July 2. Whether the bears have enough strength to reach this level is a big question.
The information background on Tuesday allowed the dollar to show growth in the second half of the day, as the only JOLTS report, indirectly related to the labor market, showed a higher value than traders expected. We saw a slight increase in the dollar, but all of Tuesday's trading occurred within Monday's range. Today, the most important event of the day is the FOMC meeting. All the important information will likely be revealed during the press conference, but there is a high probability that Jerome Powell will once again take a cautious stance. I do not expect him to change his rhetoric to a "dovish" stance today. The market can perceive any deviation from Powell's statements at the last meeting very emotionally.
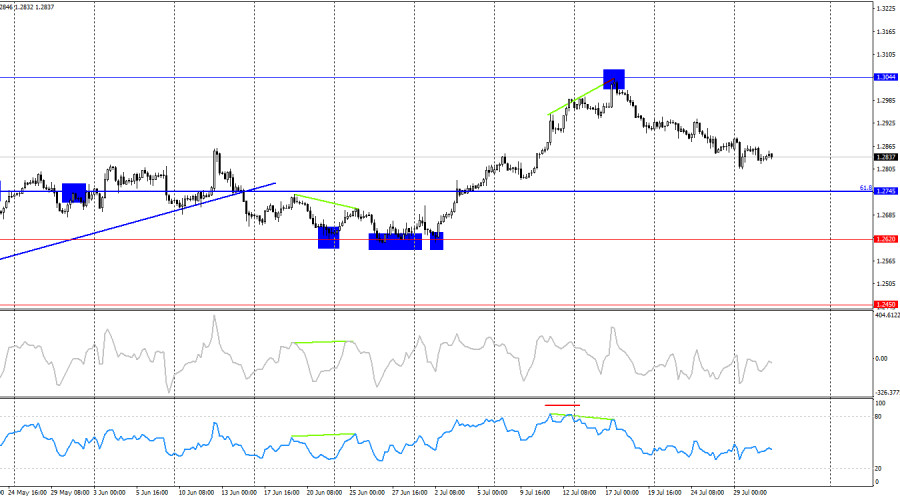
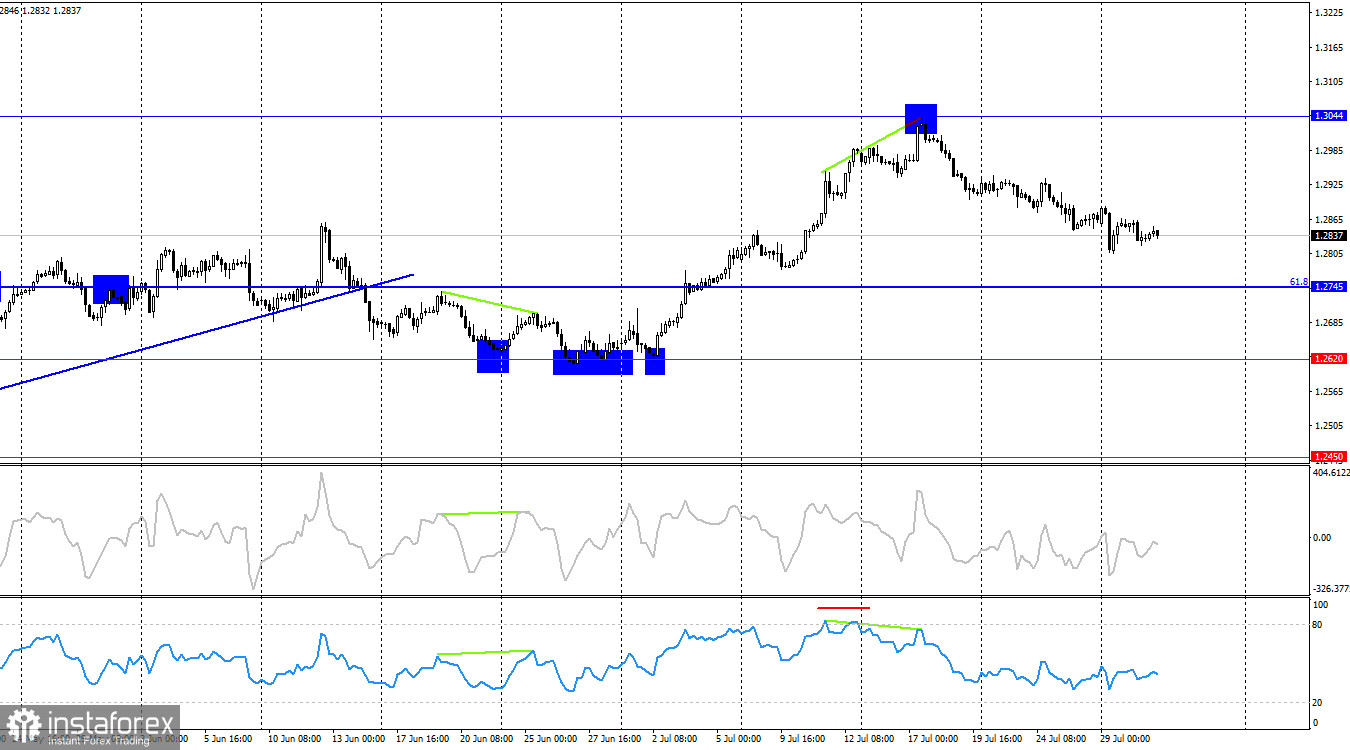
On the 4-hour chart, the pair rebounded from the 1.3044 level, forming a "bearish" divergence on the RSI indicator. Shortly before, this same indicator entered the overbought zone. Thus, several sell signals were received on the senior chart. The decline may continue towards the 61.8% corrective level at 1.2745. On the hourly chart, the bears closed below the trend channel, suggesting a continuation of the decline.
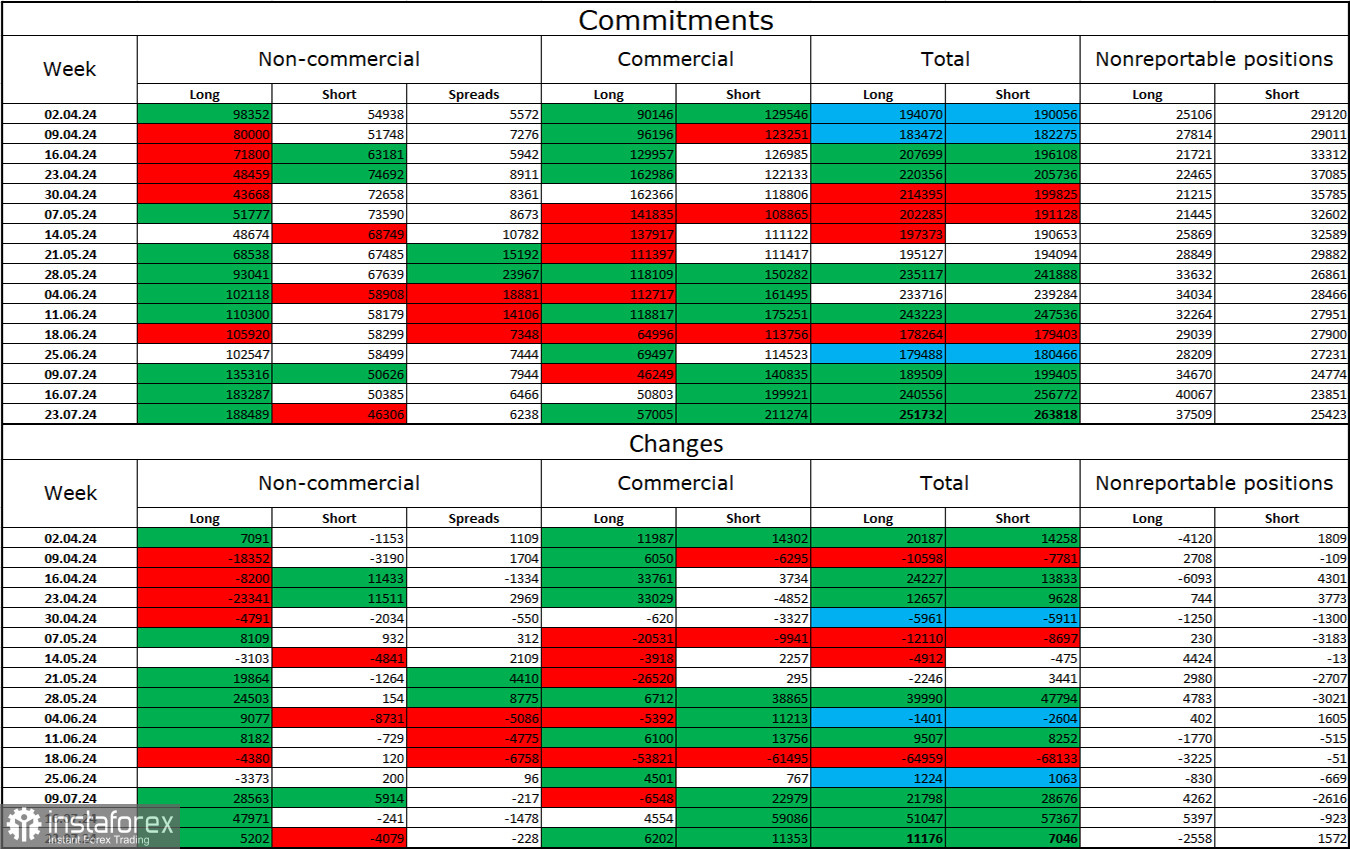
Commitments of Traders (COT) Report:
The sentiment of the "Non-commercial" category of traders became even more "bullish" over the last reporting week. The number of long positions held by speculators increased by 5,202, and the number of short positions decreased by 4,079. The bulls still have a solid advantage. The gap between long and short positions is already 142,000: 188,000 versus 46,000.
The prospects for the pound to fall remain, but the COT reports suggest otherwise. Over the past three months, the number of long positions has increased from 98,000 to 188,000, while the number of short positions has decreased from 54,000 to 46,000. Over time, professional players will again start to get rid of long positions or increase short positions, as all possible factors for buying the British pound have already been realized. However, it is important to remember that this is just an assumption. Graphical analysis suggests a likely decline in the near future, but this does not mean the decline will last several months or half a year.
News Calendar for the US and UK:
- US – ADP Employment Change (12:15 UTC).
- US – FOMC Rate Decision (18:00 UTC).
- US – FOMC Press Conference (18:30 UTC).
On Wednesday, the economic events calendar contains three entries, all of which are important. The impact of the informational background on market sentiment today will be moderate and only in the second half of the day.
Forecast for GBP/USD and Trading Tips:
Sales of the pound were possible upon a rebound from the 1.3044 level on the 4-hour chart with the target of the lower boundary of the upward channel. These sales can now be held open with the target zone of 1.2788–1.2801, which was almost reached this week. Purchases will be possible upon a rebound on the hourly chart from the zone of 1.2788–1.2801 with a target of 1.2892.
The Fibonacci levels are constructed at 1.2892–1.2298 on the hourly chart and at 1.4248–1.0404 on the 4-hour chart.