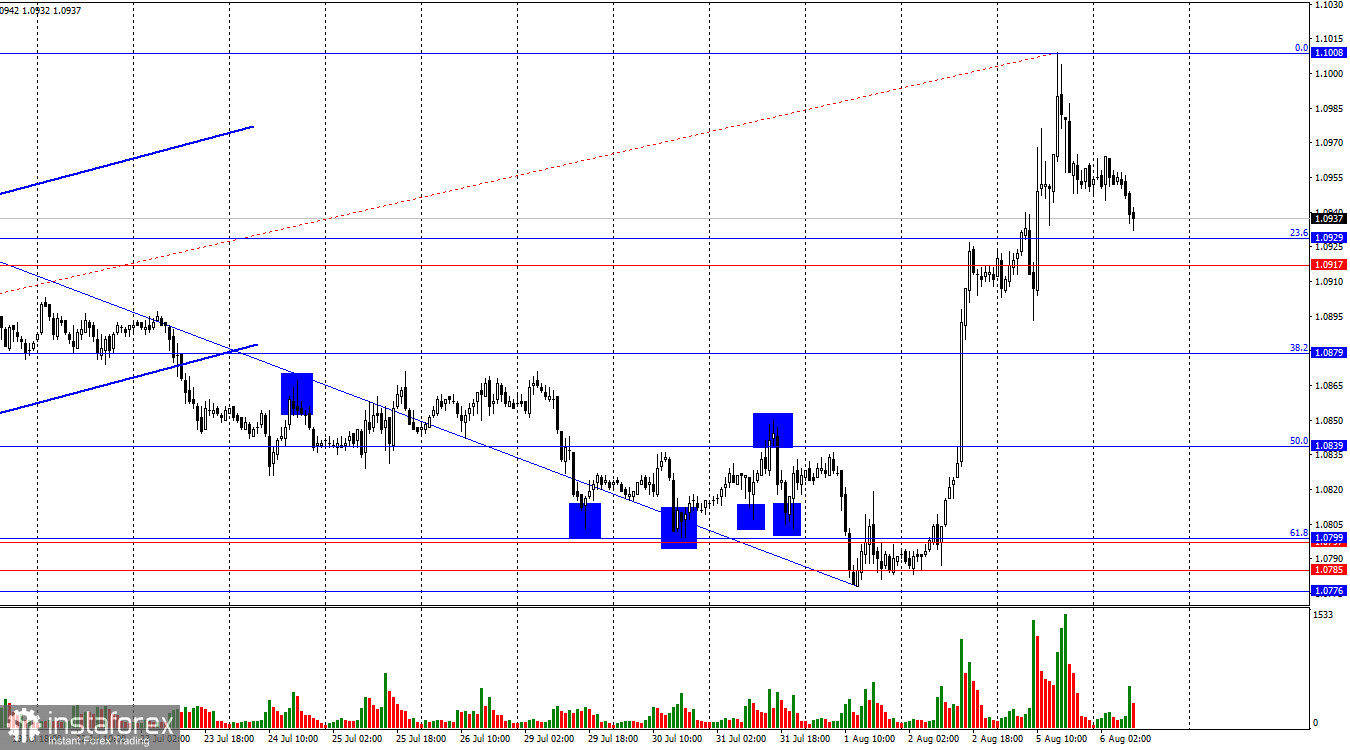
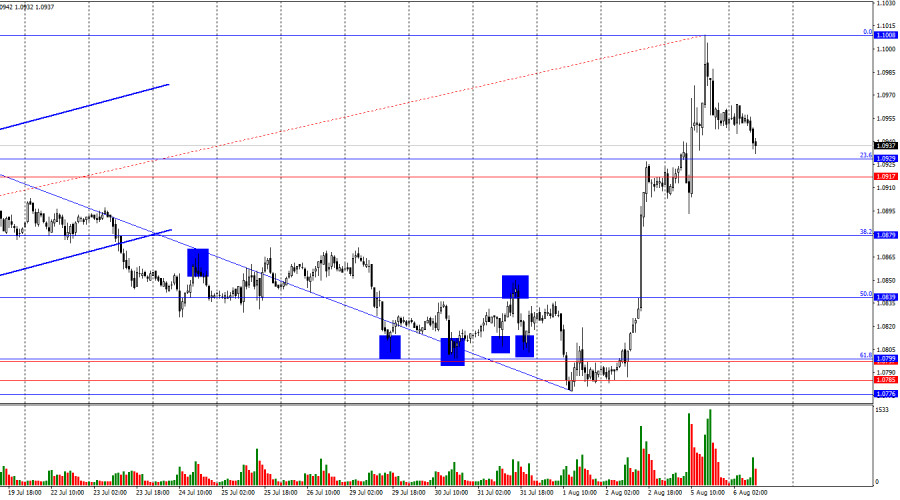
On Monday, the EUR/USD pair continued its growth and managed a rally to the 1.10 level. On the same Monday, there was a reversal in favor of the U.S. dollar, and currently, the quotes have returned to the Fibonacci level of 23.6% at 1.0929. A rebound from this level would work in favor of the European currency and resume growth towards 1.1008. Consolidating below the support zone of 1.0917–1.0929 will increase the likelihood of further declines towards the next corrective level of 38.2% at 1.0879.
The wave situation has become a bit more complex but generally raises no questions. The last completed downward wave did not break the low of the previous wave, while the new upward wave broke the peak of the previous wave (from July 16). Thus, the "bullish" trend is still intact. For the "bullish" trend to be canceled, bears now need to break the low of the last downward wave, located near the level of 1.0778. Even better would be securing below the zone of 1.0776–1.0799, which acts as the strongest support.
The information background on Monday was not significant. There were few important reports, and the market was in shock after the news about a possible Federal Reserve rate cut in September by 0.50%. These rumors started to emerge after Friday's labor market and unemployment reports. Who spread them is not entirely clear, but many major banks sharply raised their forecasts for monetary policy easing by the end of the year after Friday's statistics in the U.S. However, some banks have not changed their forecasts. Therefore, the opinion that the FOMC will lower the rate by more than 0.50% by the end of the year is not unanimous. Yet, the market immediately panicked, leading to a drop in the dollar. In my opinion, there is still no recession in the U.S. economy. If it were approaching, the Fed would have lowered the rate last week. It is hard to believe that two reports have turned everything upside down in the U.S. economy.
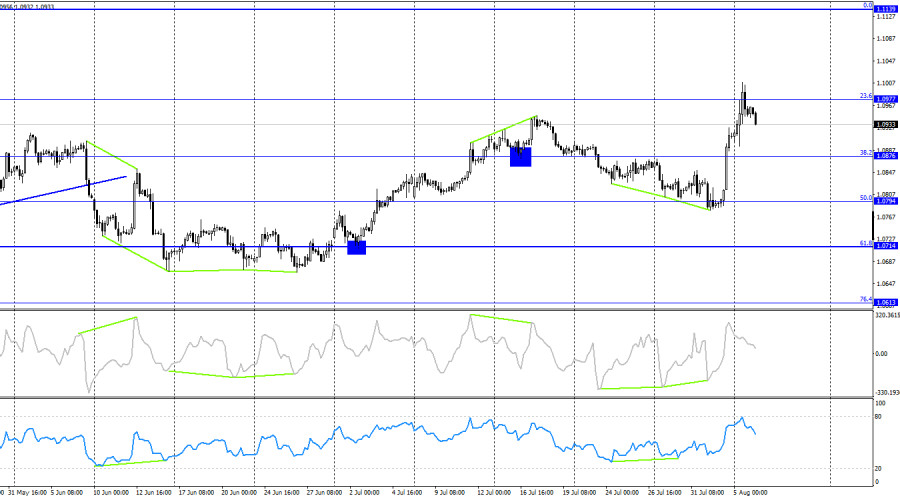
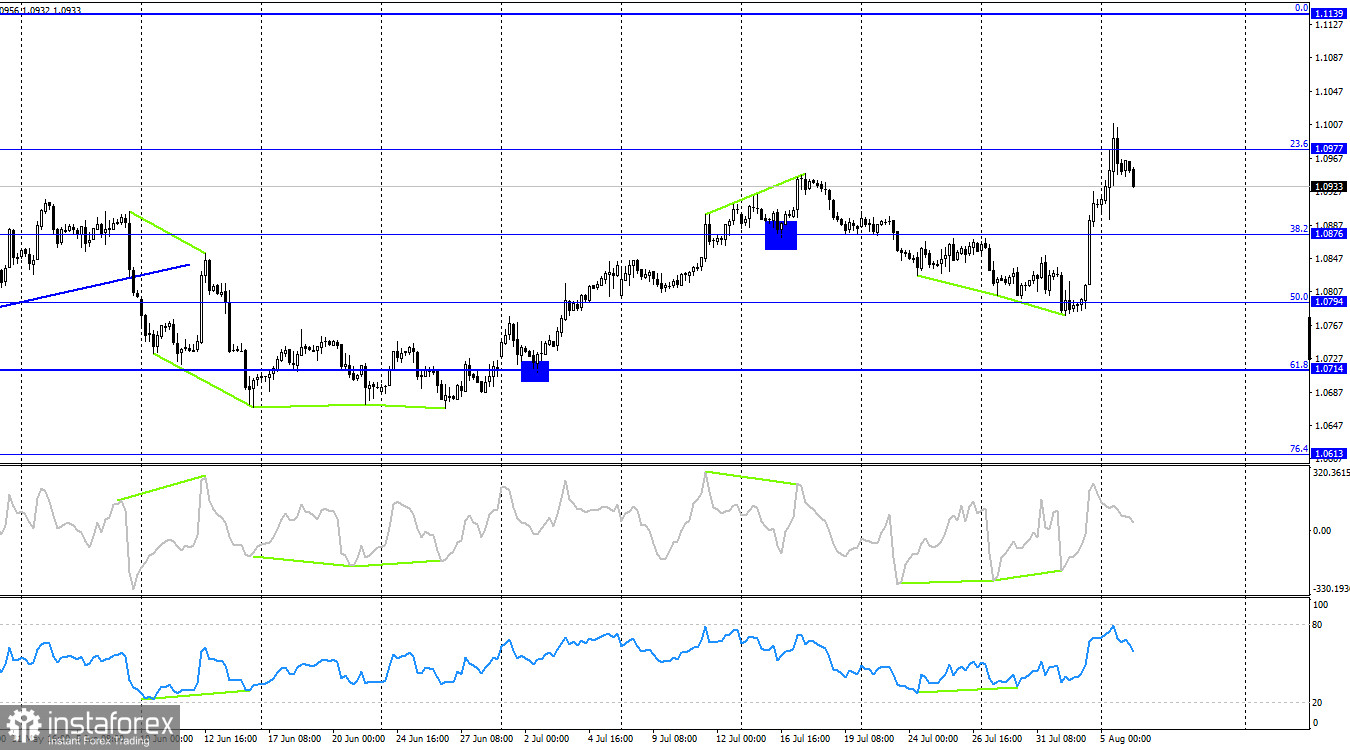
On the 4-hour chart, the pair rebounded from the Fibonacci corrective level of 23.6% at 1.0977 and turned in favor of the U.S. dollar. Thus, the decline in quotes may continue towards the next Fibonacci level of 38.2% at 1.0876. Holding the pair above the level of 1.0977 will increase the likelihood of continued growth towards the next corrective level of 0.0% at 1.1139. No emerging divergences are observed today on any indicator.
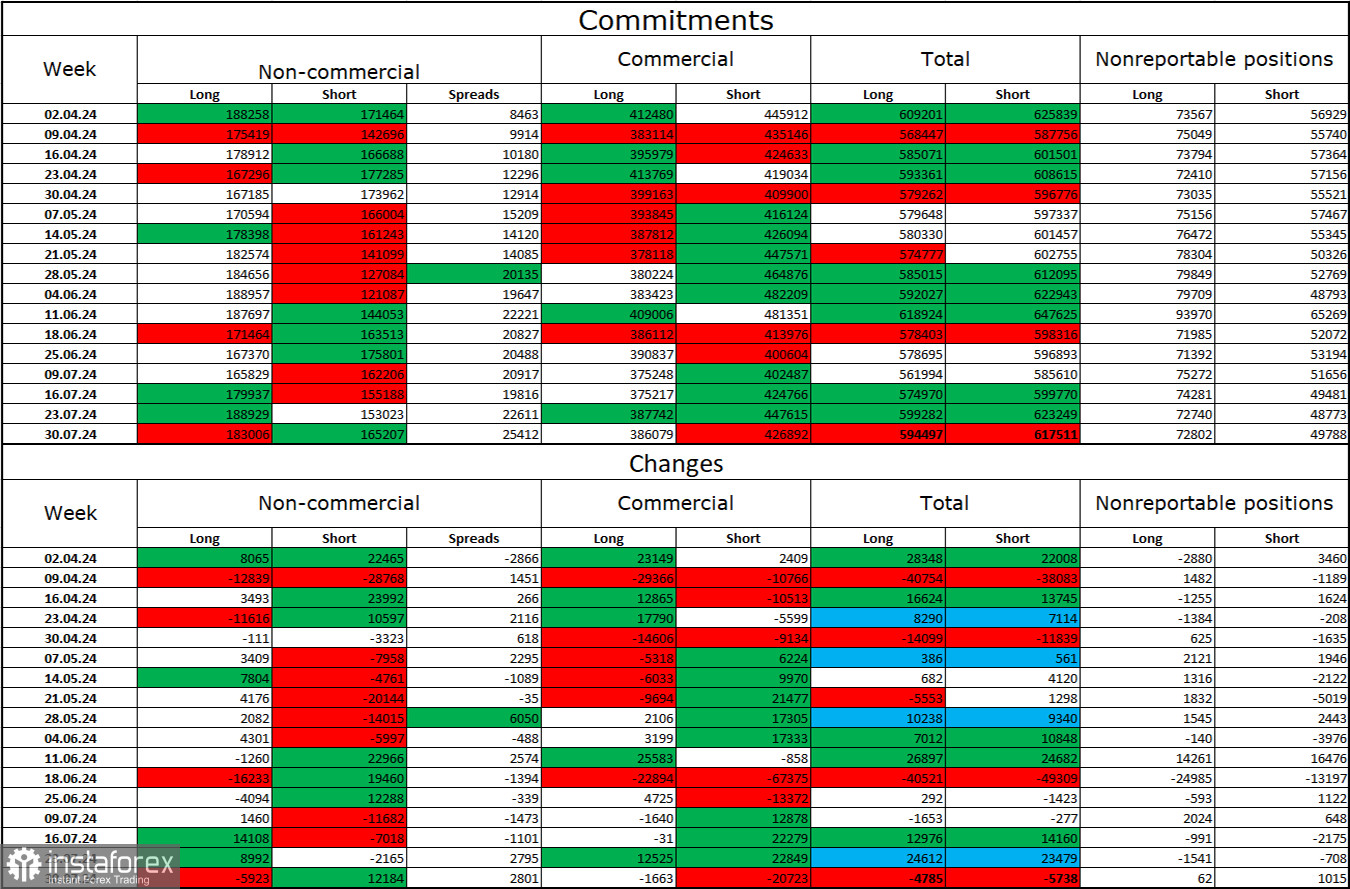
Commitments of Traders (COT) Report:
Over the last reporting week, speculators closed 5,923 long positions and opened 12,184 short positions. The mood of the "Non-commercial" group shifted to "bearish" a few months ago, but at this time, the bulls again dominated. The total number of long positions held by speculators now stands at 183,000, while short positions are at 165,000.
I still believe that the situation will continue to change in favor of the bears. I see no long-term reasons to buy the euro, as the ECB has begun easing monetary policy, which will lower the yield on bank deposits and government bonds. In the U.S., however, they will remain high at least until September, making the dollar more attractive to investors. The potential for the European currency to decline looks impressive. However, one should not forget about graphical analysis, which currently does not allow confidently speaking of a strong fall in the euro, as well as about the information background that regularly throws spanners in the works for the dollar.
News Calendar for the U.S. and Eurozone:
Eurozone - Retail Sales (09-00 UTC).
On August 6, the economic events calendar contains only one entry. The impact of the information background on traders' mood today may be very weak.
Forecast for EUR/USD and Advice to Traders:
Sales of the pair are possible today with a target of 1.0879 on the hourly chart if quotes consolidate below the support zone of 1.0917–1.0929. Purchases will be possible upon a bounce from the support zone of 1.0917–1.0929 on the hourly chart with a target of 1.1008.
Fibonacci level grids are constructed from 1.0668–1.1008 on the hourly chart and from 1.0450–1.1139 on the 4-hour chart.