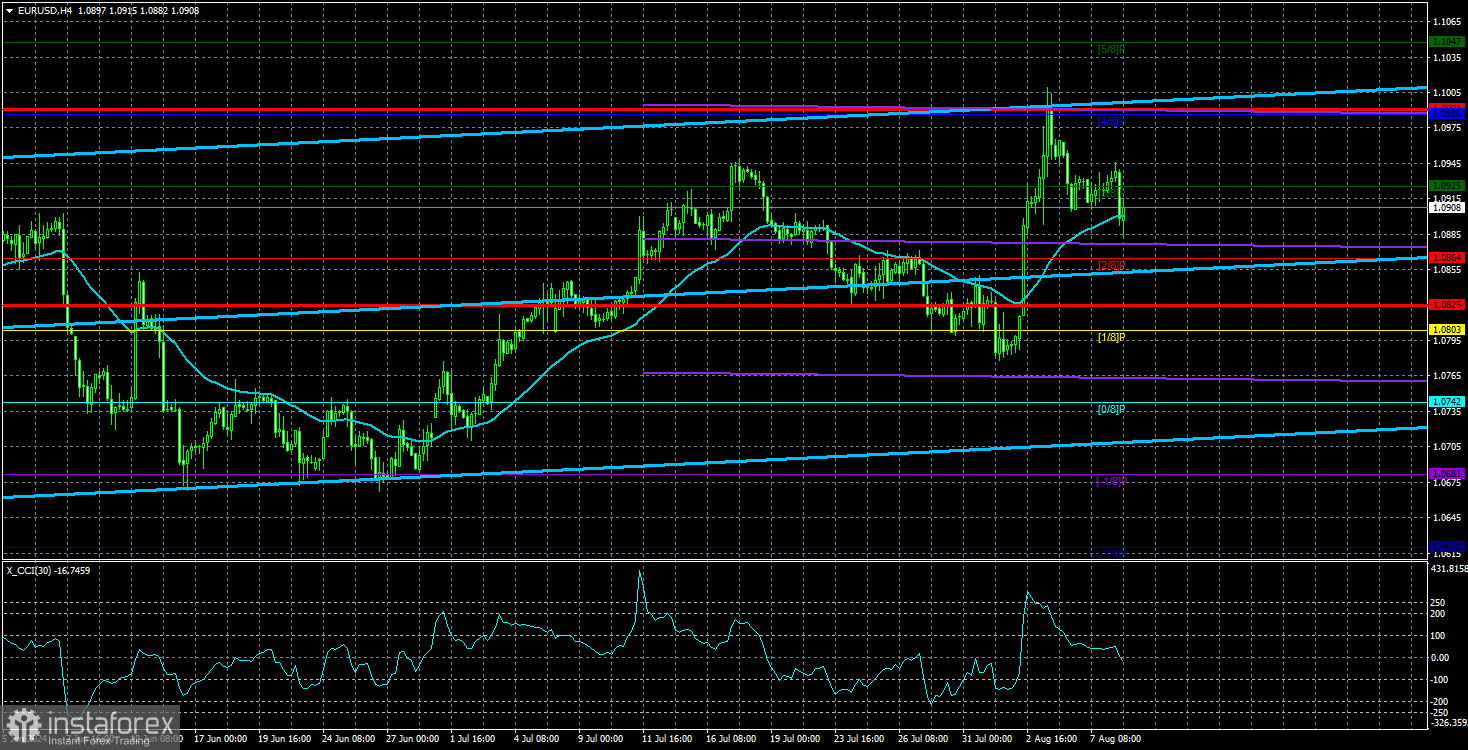
جمعرات کو، یورو/امریکی ڈالر کے جوڑے نے عام طور پر اپنی کمی کو برقرار رکھا۔ قیمت نے دن کے دوران موونگ ایوریج لائن کے ذریعے کام کیا لیکن اس پر قابو پانے میں ناکام رہا۔ اس طرح، تکنیکی طور پر، ڈالر کے امکانات غیر واضح ہیں۔ اس کی تکنیکی تصویر 24 گھنٹے کے ٹائم فریم میں پرامید نظر آتی ہے، جہاں 1.06-1.10 کا افقی چینل برقرار رہتا ہے۔ اور چونکہ اس ہفتے ہی اس چینل کی اوپری باؤنڈری سے قیمت دوبارہ بڑھی ہے، تاجر اب توقع کر سکتے ہیں کہ یہ نچلی حد تک گر جائے گی۔ تاہم، یہ سمجھنا چاہیے کہ فلیٹ ہمیشہ نہیں رہے گا۔ یہ جلد یا بدیر ختم ہو جائے گا.
4 گھنٹے کے ٹائم فریم میں، تصویر کچھ زیادہ خراب ہے۔ امریکی ڈالر کو مزید مضبوط کرنے کے لیے اسے متحرک اوسط سے نیچے مستحکم کرنے کی ضرورت ہے، جو کہ ابھی ہونا باقی ہے۔ تاہم یہاں بھی حالات اتنے خراب نہیں ہیں جتنے کہ نظر آتے ہیں۔ متحرک اوسط سے صحت مندی لوٹنا ہمیشہ ایک عام ردعمل ہوتا ہے۔ یہ اس بات کی نشاندہی نہیں کرتا ہے کہ اب مقامی اوپر کی طرف رجحان دوبارہ شروع ہو جائے گا۔ یاد رکھیں، سی سی آئی انڈیکیٹر دو بار زیادہ خریدے ہوئے علاقے میں داخل ہوا اور اس نے بیئرش ڈائیورجن بنایا۔ اس طرح، جوڑی میں کمی سب سے زیادہ ممکنہ تکنیکی منظر نامے کی حیثیت رکھتی ہے۔
میکرو اکنامک کے لحاظ سے، کئی وجوہات کی بنا پر ڈالر کے لیے چیزیں مسلسل خراب ہیں۔ سب سے پہلے اہم میکرو اکنامک اشاریوں کے لیے زیادہ تخمینہ شدہ پیش گوئیاں ہیں۔ ہم پہلے ہی بتا چکے ہیں کہ ایسے موڈ میں ڈالر غیر معینہ مدت تک گر سکتا ہے۔ مارکیٹ ہر رپورٹ سے اس سے کہیں زیادہ کی توقع رکھتی ہے جو حقیقت پسندانہ ہو سکتی ہے۔ مبالغہ آمیز پیش گوئیاں صرف بعض اوقات موجود ہوتی ہیں لیکن اکثر اوقات۔ اس بات سے کوئی انکار نہیں کرتا کہ پچھلے 3-4 مہینوں میں بہت سی رپورٹس کمزور رہی ہیں، لیکن حال ہی میں مضبوط رپورٹس بھی سامنے آئی ہیں، جیسے کہ آئی ایس ایم سروسز سیکٹر بزنس ایکٹیویٹی انڈیکس اور دوسری سہ ماہی کے لیے جی ڈی پی۔
ایک بنیادی نقطہ نظر سے، ڈالر کی صورت حال بیک وقت اچھی اور بری دونوں ہے۔ ہمیں یقین ہے کہ بنیادی اصول ڈالر کی حمایت کرتے ہیں، لیکن مارکیٹ اس کے برعکس سوچتی ہے۔ آئیے تضادات کی وضاحت کرتے ہیں۔ سال کے آغاز سے، مارکیٹ فیڈرل ریزرو سے اپنی شرح سود کو کم کرنے کی توقع کر رہی ہے، اور اس سارے عرصے میں، اس نے اس واقعہ کا پہلے سے جواب دیا ہے۔ فیڈ نے ابھی تک مالیاتی نرمی شروع کرنا ہے۔ تاہم، مارکیٹ کے شرکاء نئی، زیادہ سے زیادہ غیر حقیقی پیشین گوئیاں کرتے ہوئے صورتحال کو ہلا کر رکھ دیتے ہیں، جو کہ بدلے میں، ڈالر کی فروخت سے ظاہر ہوتے ہیں۔ مارکیٹ کو سال کے آخر تک تقریباً 1.5% کی شرح میں کمی کی توقع ہے، کیونکہ اس نے لیبر مارکیٹ اور بے روزگاری کی تازہ ترین رپورٹیں خاص طور پر مایوس کن پائی ہیں۔
اگر ہم کی شرح میں کمی کی مارکیٹ کی مبالغہ آمیز توقعات کو دیکھیں (جسے Fed کے چیئرمین جیروم پاول نے متعدد مواقع پر خطاب کیا ہے)، تو بنیادی اصول ڈالر کی حمایت کرتے ہیں۔ فیڈ اپنی شرح کو بلند ترین قیمت پر برقرار رکھتا ہے، اور افراط زر ہدف کی سطح سے اوپر رہتا ہے، جس سے شرح میں کمی کی کوئی بنیاد نہیں ہے۔ امریکی معیشت بھی مضبوط نمو دکھا رہی ہے، جو اکثر مارکیٹ کی توقعات سے آگے نکل جاتی ہے۔ اس لیے کساد بازاری کے کوئی آثار نظر نہیں آتے اور نہ ہی مستقبل قریب میں اس کی توقع ہے۔
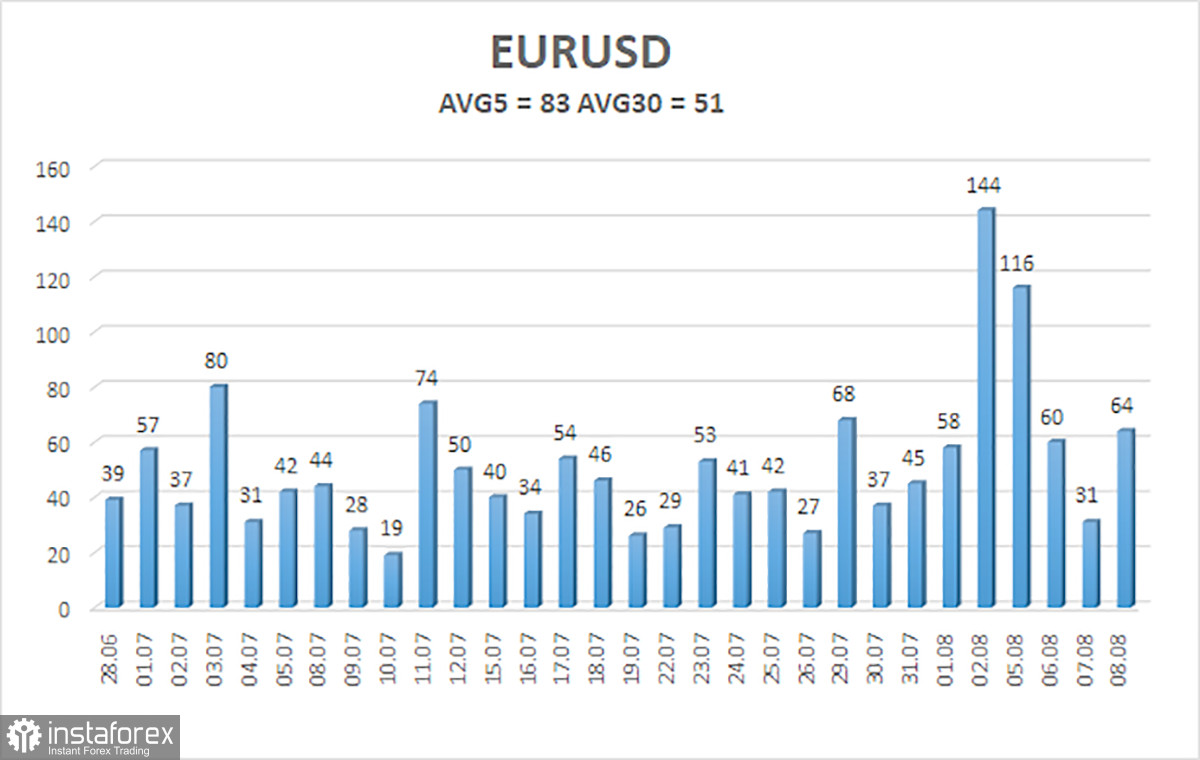
9 اگست تک گزشتہ پانچ تجارتی دنوں میں یورو/امریکی ڈالر کی اوسط اتار چڑھاؤ 83 پپس ہے، جسے اوسط سمجھا جاتا ہے۔ ہم توقع کرتے ہیں کہ جوڑا جمعہ کو 1.0825 اور 1.0991 کی سطح کے درمیان چلے گا۔ اعلی لکیری ریگریشن چینل اوپر کی طرف جاتا ہے، لیکن عالمی نیچے کی طرف رجحان برقرار رہتا ہے۔ CCI انڈیکیٹر دوسری بار زیادہ خریدے ہوئے علاقے میں داخل ہوا، ایک بار پھر ڈاون ٹرینڈ میں ممکنہ تبدیلی کا انتباہ۔
قریبی سپورٹ لیول:
S1 – 1.0864
S2 – 1.0803
S3 – 1.0742
قریبی مزاحمتی لیول:
R1 – 1.0925
R2 – 1.0986
R3 – 1.1047
تجارتی تجاویز:
یورو/امریکی ڈالر کا جوڑا عالمی سطح پر نیچے کی طرف رجحان کو برقرار رکھتا ہے اور 4 گھنٹے کے وقت کے فریم میں، اس نے نیچے کی طرف اصلاح شروع کی، جو نیچے کی طرف ایک نئی لہر کے آغاز کی نشان دہی کر سکتی ہے۔ پچھلے جائزوں میں، ہم نے ذکر کیا کہ ہم صرف یورو سے کمی کی توقع کر رہے ہیں۔ ہمیں یقین نہیں ہے کہ یورپی سنٹرل بینک کی مانیٹری پالیسی میں نرمی کے درمیان یورو ایک نیا عالمی رجحان شروع کر سکتا ہے، اس لیے جوڑا ممکنہ طور پر کچھ وقت کے لیے 1.0600 اور 1.1000 کے درمیان اتار چڑھاؤ کا شکار رہے گا۔ ابھی کے لیے، ایسا لگتا ہے جیسے قیمت افقی چینل کی اوپری باؤنڈری سے اچھال گئی ہے اور نچلی حد کی طرف بڑھ رہی ہے۔
تصاویر کی وضاحت:
لکیری ریگریشن چینلز: موجودہ رجحان کا تعین کرنے میں مدد کریں۔ اگر دونوں ایک ہی سمت میں ہیں، تو اس کا مطلب ہے کہ رجحان مضبوط ہے۔
موونگ ایوریج لائن (ترتیبات 20,0، ہموار): مختصر مدت کے رجحان اور اس سمت کا تعین کرتی ہے جس میں ٹریڈنگ کی جانی چاہیے۔
مرے لیولز: حرکات اور اصلاح کے لیے ہدف کی سطح۔
اتار چڑھاؤ کی سطحیں (سرخ لکیریں): قیمت کا ممکنہ چینل جس میں جوڑا اگلے 24 گھنٹے گزارے گا، موجودہ اتار چڑھاؤ کے اشارے کی بنیاد پر۔
سی سی آئی انڈیکیٹر: اوور سیلڈ ایریا (250 سے نیچے) یا زیادہ خریدا ہوا ایریا (+250 سے اوپر) میں داخل ہونے کا مطلب ہے کہ ٹرینڈ ریورسل قریب آ رہا ہے۔