In my morning forecast, I highlighted several levels and planned to make decisions on market entry based on them. Let's examine the 5-minute chart to analyze what occurred. Unfortunately, due to extremely low volatility, around 15 points, it was not possible to achieve adequate entry points into the market in the first half of the day. The technical outlook has not been revised for the second half of the day.
For Opening Long Positions on EUR/USD:
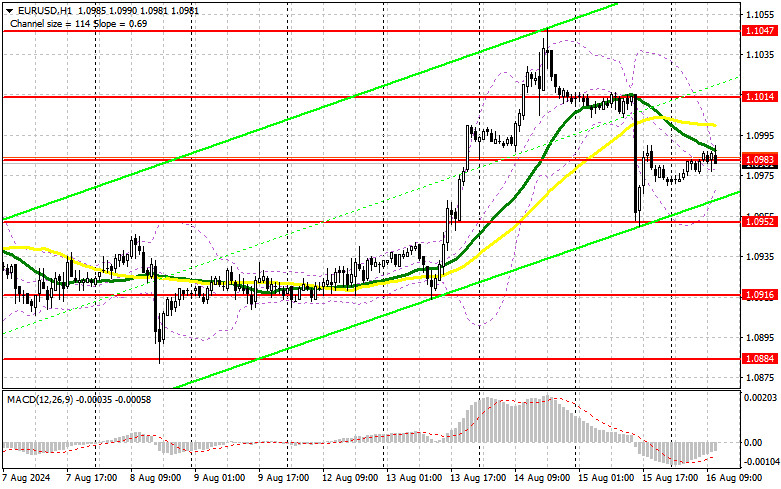
Clearly, the data on the Eurozone trade balance had no impact on the euro, nor was it expected to. Attention now shifts to the reports on the U.S. housing market. However, I strongly doubt that this data release will significantly change the market, so it's better to stick to trading within the channel and not expect anything major at the end of the week. The number of building permits issued and housing starts might slightly push the market toward strengthening the U.S. dollar, but this is unlikely. The University of Michigan Consumer Sentiment Index and inflation expectations are also likely to go unnoticed, particularly as no significant changes are expected in these indicators. Given that the technical outlook has not been revised, in the case of poor statistics, a decline and the formation of a false breakout around the support level of 1.0952 would provide a suitable condition for opening long positions, with the expectation of the euro rising and strengthening the bullish trend. A breakout and subsequent upward movement beyond 1.1014 (a rather significant resistance level) could strengthen the pair, with a chance to rise toward 1.1047. The furthest target would be the 1.1076 high, where I would look to take profits. In the scenario of a decline in EUR/USD and a lack of activity around 1.0952 in the second half of the day, which is unlikely, sellers will have a chance for a larger correction and may take active measures, aiming for a drop in the pair. In such a case, I would only consider entering after a false breakout around the next support at 1.0916. I would open long positions immediately on a rebound from 1.0884, targeting an upward correction of 30-35 points within the day.
For Opening Short Positions on EUR/USD:
Sellers have not been very active. A false breakout at 1.1014 following the data release would provide a suitable scenario for opening short positions, targeting a decline to the intermediate support at 1.0983. A breakout and consolidation below this range, followed by a retest from below, would provide another selling point with a move toward 1.0952, where I expect to see more active buying. The furthest target would be around 1.0916, where I would take profits. Testing this level would thwart the euro buyers' plans to establish an upward trend. If EUR/USD rises in the second half of the day due to weak U.S. statistics and there is no bearish activity at 1.1014, buyers will likely continue to establish a new upward trend. In that case, I would postpone selling until testing the next resistance at 1.1047. I would also act there, but only after an unsuccessful consolidation. I plan to open short positions immediately on a rebound from 1.1076, targeting a downward correction of 30-35 points.
The COT (Commitment of Traders) report for August 6 showed an increase in long positions and a decrease in short ones. It's clear that the new course of the Federal Reserve toward easing monetary policy has not gone unnoticed, and even though similar actions are expected from the ECB, the euro still has a good chance of recovering against the dollar, as the U.S. regulator could surprise everyone this fall by cutting rates by half a percent. A series of statistics will be released in the near future, which will determine the Fed's further actions, so keep a close eye on the economic calendar. The COT report indicated that non-commercial long positions increased by 2,793 to 185,799, while non-commercial short positions decreased by 12,988 to 152,219. As a result, the gap between long and short positions narrowed by 1,293.
Indicator Signals:
Moving Averages:
Trading is taking place around the 30 and 50-day moving averages, indicating market uncertainty.
Note: The period and prices of the moving averages are considered by the author on the hourly H1 chart and differ from the general definition of classic daily moving averages on the D1 daily chart.
Bollinger Bands:
In the event of a decline, the lower boundary of the indicator around 1.0975 will serve as support.
Indicator Descriptions:
- Moving Average: Determines the current trend by smoothing out volatility and noise. Period 50. Marked in yellow on the chart.
- Moving Average: Determines the current trend by smoothing out volatility and noise. Period 30. Marked in green on the chart.
- MACD Indicator: Moving Average Convergence/Divergence—EMA period 12, Slow EMA period 26, SMA period 9.
- Bollinger Bands: Period 20.
- Non-commercial traders: Speculators such as individual traders, hedge funds, and large institutions using the futures market for speculative purposes and meeting certain requirements.
- Non-commercial long positions: The total sum of long open positions of non-commercial traders.
- Non-commercial short positions: The total sum of short open positions of non-commercial traders.
- Total non-commercial net position: The difference between short and long positions of non-commercial traders.


