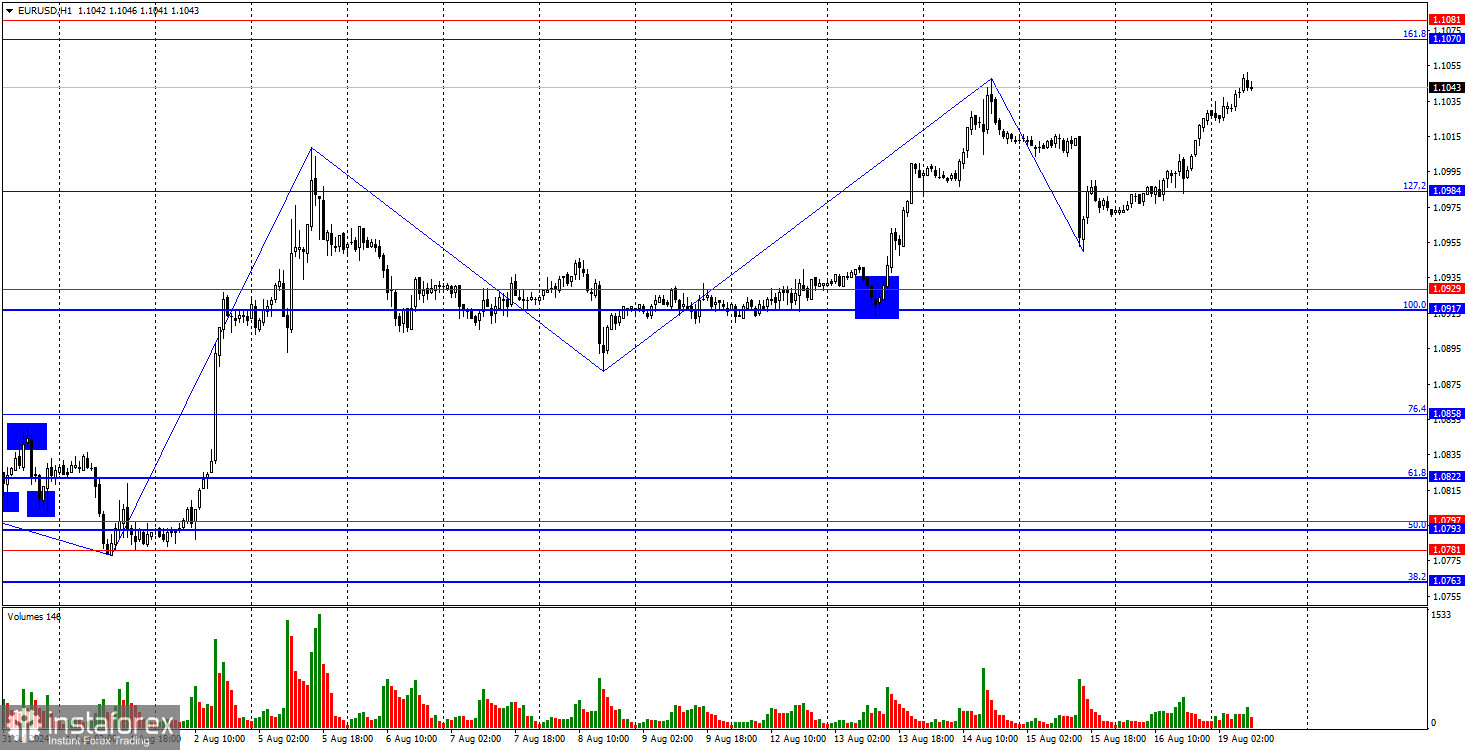
On Friday, the EUR/USD pair consolidated above the 127.2% corrective level at 1.0984 and continued to rise towards the 161.8% Fibonacci level at 1.1070. Judging by the size of the waves and corrections, it seems that the bullish momentum is fading. The corrections are becoming deeper, and the bullish waves are getting weaker. Therefore, I do not expect the pair to sustain its position above the 1.1070 level. A rebound from this level would benefit the U.S. dollar and could trigger a decline towards the support zone between 1.0917 and 1.0929.
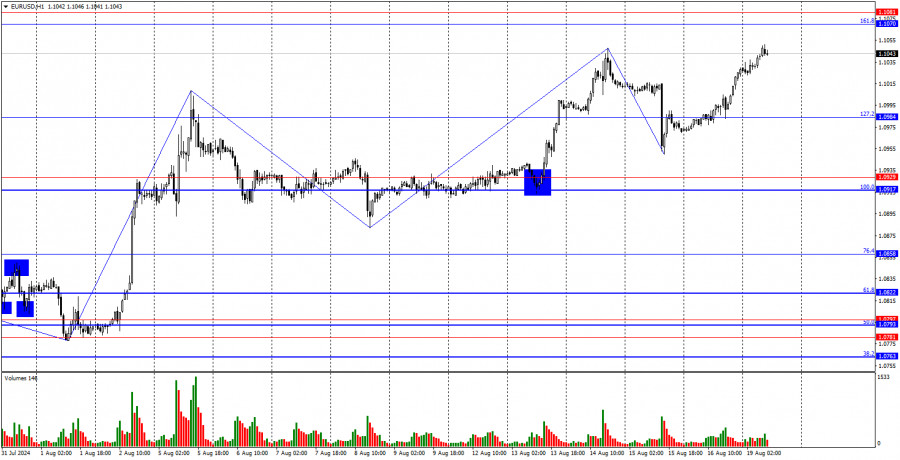
The wave structure has become slightly more complex, but overall it remains clear. The last completed wave down did not break the low of the previous wave. The new wave up has already broken the peak from August 14, albeit by only a few points. If a more significant breakout does not occur, it may indicate the end of the bullish trend. However, the bullish trend remains intact. To negate this trend, the bears need to break the low of the last wave down, which is around the 1.0950 level.
The fundamental backdrop on Friday once again did nothing to help the U.S. dollar. The University of Michigan's Consumer Sentiment Index came in slightly above traders' expectations, but the earlier report on building permits was worse than expected. We might have expected at least a halt in the decline of the U.S. currency, if not an increase, but it appears the bulls are making a final push, aiming to elevate the pair as much as possible before the anticipated bearish trend. As we can see, the fundamental backdrop no longer serves as a clear reason for market purchases or sales. This indicates that the bullish trend is nearing its end—unless the fundamentals provide the bulls with new reasons to attack aggressively, which cannot be ruled out, as the U.S. has released quite a bit of negative information over the past 3-4 months, contributing significantly to the dollar's decline.
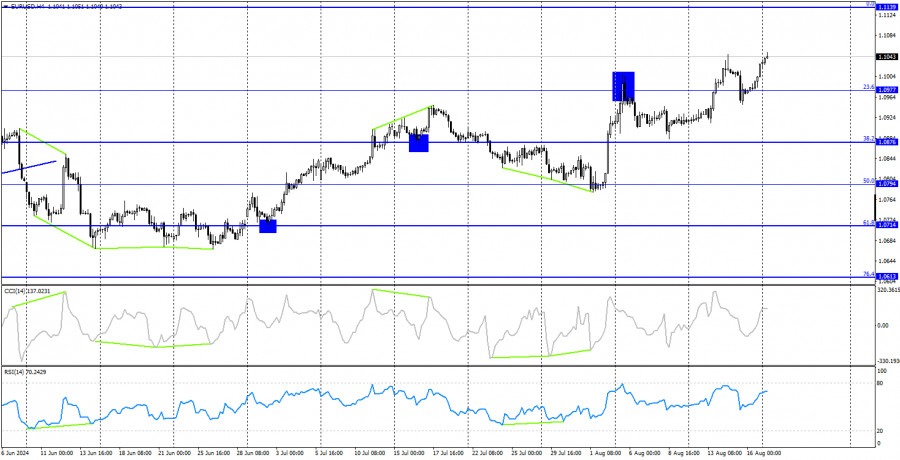
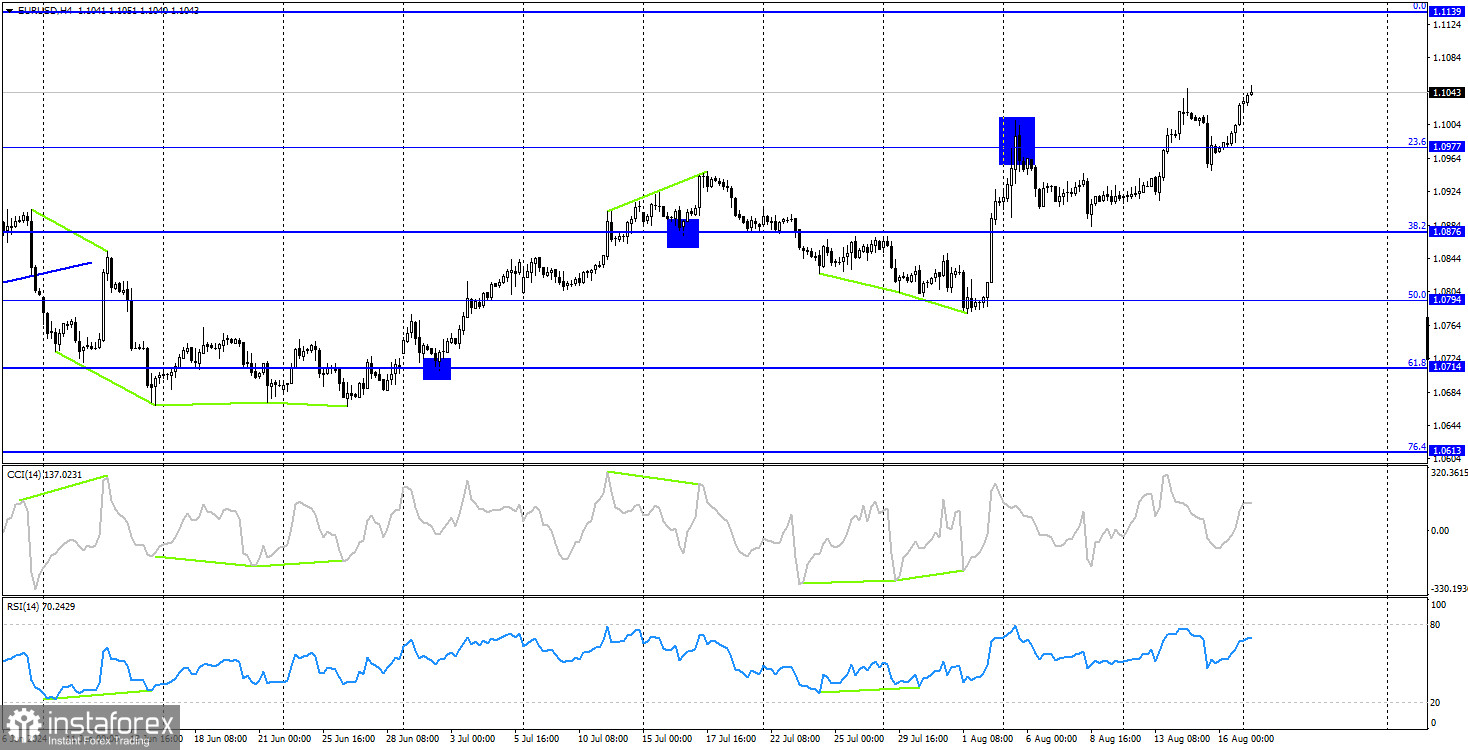
On the 4-hour chart, the pair reversed in favor of the euro around the 38.2% corrective level at 1.0876 and initiated a new upward movement. The consolidation above the 23.6% Fibonacci level at 1.0977 suggests that the pair could continue to rise towards the next corrective level at 0.0% – 1.1139. No impending divergences are observed on any indicators. In my opinion, the current growth does not fully align with the fundamental backdrop, but the technical picture still clearly indicates a bullish trend with no signs of ending.
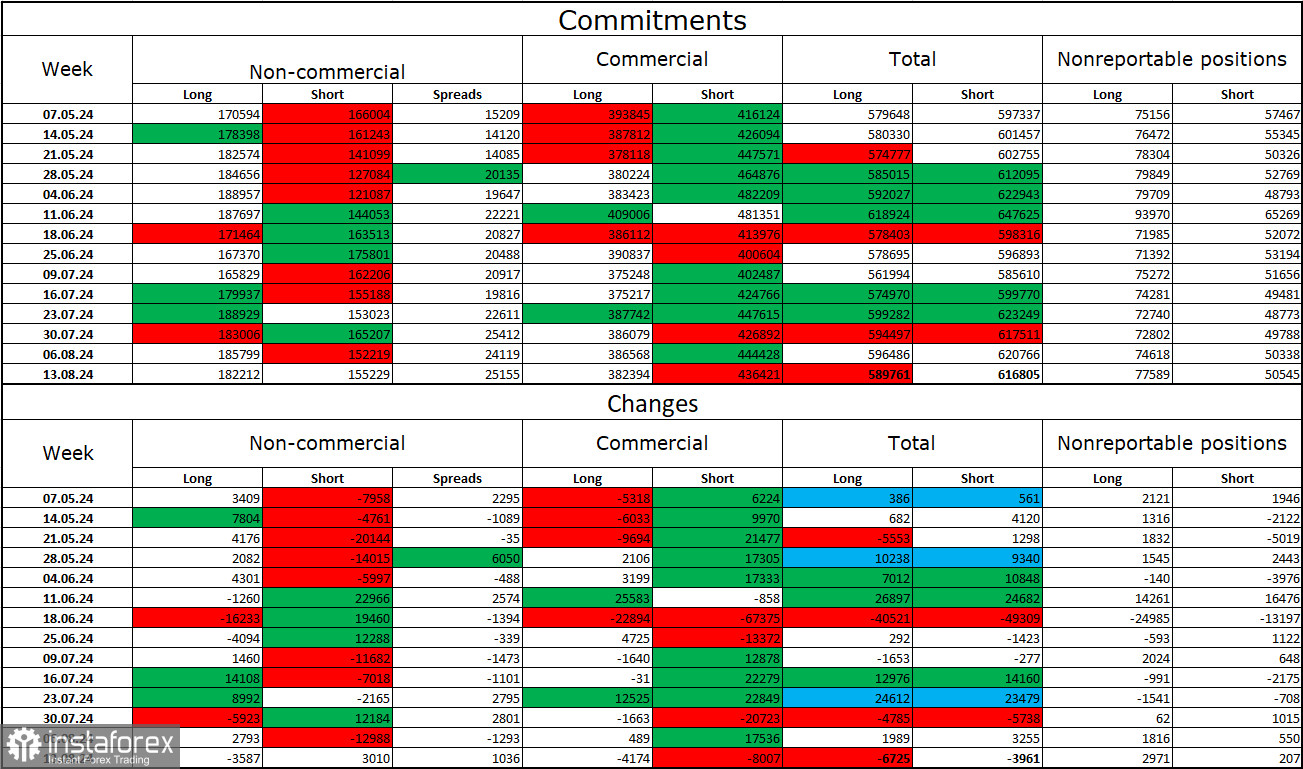
Commitments of Traders (COT) Report:
During the last reporting week, speculators closed 3,587 long positions and opened 3,010 short positions. The sentiment of the "Non-commercial" group turned bearish several months ago, but currently, the bulls are once again dominating. The total number of long positions held by speculators is now 182,000, while short positions amount to 155,000.
I still believe that the situation will continue to shift in favor of the bears. I see no long-term reasons to buy the euro, as the ECB has begun easing its monetary policy, which will reduce the yield on bank deposits and government bonds. In the U.S., however, yields are expected to remain high at least until September, making the dollar more attractive to investors. The potential for a decline in the euro looks substantial. However, it is important not to overlook the technical analysis, which currently does not allow for a confident prediction of a sharp decline in the euro, and the fundamental backdrop, which continues to pose challenges for the dollar.
News Calendar for the U.S. and Eurozone:
The economic calendar for August 19 does not contain any noteworthy entries. The fundamental backdrop is not expected to influence traders' sentiment today.
EUR/USD Forecast and Trading Advice:
Selling the pair today could be considered if there is a rebound from the 1.1070 level on the hourly chart, with targets at 1.0984 and 1.0929. I would now approach buying with caution, as the bullish trend is fading, and without new data that would pressure the dollar, it will be difficult for the pair to continue rising.
The Fibonacci levels are plotted between 1.0917 and 1.0668 on the hourly chart, and between 1.0450 and 1.1139 on the 4-hour chart.