empty
20.08.2024 04:23 PM
Analysis for GBP/USD pair on August 20, 2024

This image is no longer relevant

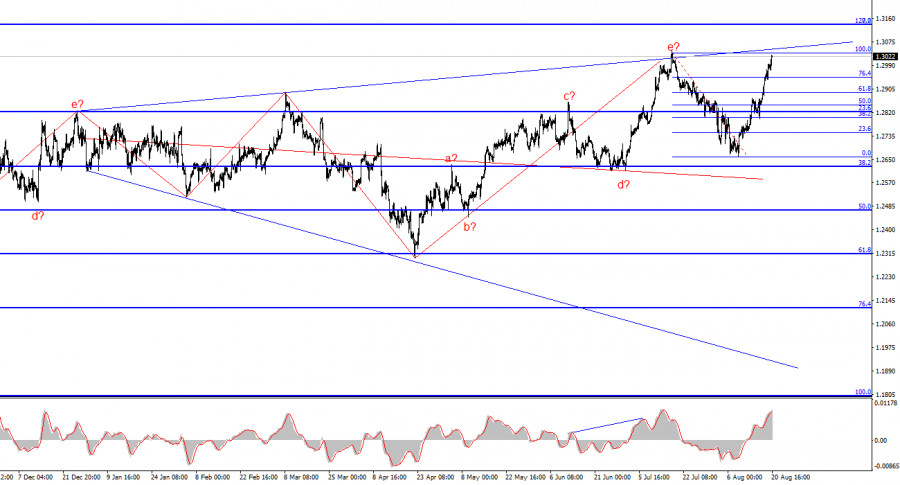
The wave analysis for GBP/USD remains quite complex and ambiguous. For a while, the wave pattern appeared quite convincing, suggesting a downward wave sequence with targets below the 1.2300 level. However, in practice, demand for the U.S. dollar surged too significantly to realize this scenario.

Currently, the wave pattern has become completely unreadable. As a reminder, I prefer to use simple structures in my analysis because complex ones involve too many nuances and ambiguities. We now observe an upward wave that has overlapped a downward wave, which in turn overlapped a previous upward wave, which itself overlapped a prior downward wave (all within a triangle). The only assumption now is an expanding triangle with the upper point around the 1.3000 level and a balancing line around the 1.2600 level. The upper line of the triangle has been reached, and an unsuccessful attempt to break through it indicated the market's readiness to build a downward wave sequence, the first of which is already complete, and the second is nearing completion.

The GBP/USD rate increased by 45 basis points on Monday, 90 on Friday, and another 35 on Tuesday. The pound has been rising for four consecutive days from the last pullback. If we consider the very beginning, the pound has been on an upward trajectory for nine consecutive days. Last week, there was at least some news that could have reduced demand for the U.S. dollar. Reports on inflation and producer prices in the U.S., which showed a decline, could have contributed to the dollar's fall. However, no significant news has emerged this week. The market continues to reduce demand for the dollar following Jerome Powell's Friday speech and expectations of a Fed rate cut in September.

As with EUR/USD, I have one simple question: If the two reasons for the dollar's decline are Powell's speech and the rate cut in September, how long will the dollar's decline continue? The first possible answer is obvious—until Friday. However, Powell will speak, and the factor of a rate cut in September, which no one doubts now, remains. Despite the market's confidence in the policy easing on September 18 for the past three weeks, this factor still exerts significant pressure on the U.S. dollar. The wave pattern for GBP/USD might become even more complex and unreadable today. At the moment, the instrument is unable to build even a classic three-wave correction. If the pound cannot construct a simple three-wave correction, what more complex wave structures can be discussed?

This image is no longer relevant

General Conclusions

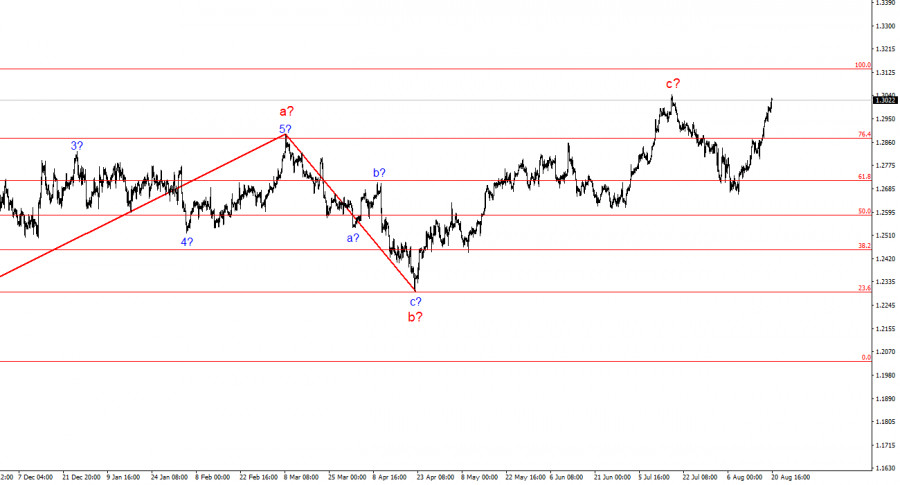
The wave pattern for GBP/USD still suggests a decline. If the upward phase of the trend began on April 22, it has already taken on a five-wave form. Therefore, at this point, a minimum of a three-wave correction should be expected. In my opinion, the instrument should be considered for sales with targets around the 1.2627 level, which corresponds to the 38.2% Fibonacci retracement, and lower. I believe that a rebound from the 1.3033 level will provide a good entry point. If the rebound is not clear and precise, it is better not to trade it.

On a larger wave scale, the wave pattern has transformed. We can now assume the development of a complex and extended upward corrective structure. Currently, it is a three-wave structure, but it could transform into a five-wave structure, which might take several more months or longer to complete.

Key Principles of My Analysis

  1. Wave structures should be simple and understandable. Complex structures are difficult to trade and often subject to changes.
  2. If there is no confidence in what is happening in the market, it is better not to enter it.
  3. Absolute certainty in the direction of movement is neither possible nor ever guaranteed. Do not forget about protective Stop Loss orders.
  4. Wave analysis can be combined with other types of analysis and trading strategies.
Chin Zhao,
انسٹافاریکس کا تجزیاتی ماہر
© 2007-2025
ٹائم فریم منتخب کریں
5
منٹ
15
منٹ
30
منٹ
1
گھنٹہ
4
گھنٹے
1
دن
1
ہفتہ
انسٹافاریکس کے ساتھ کرپٹو کرنسی کی معاملاتی تبدیلیوں سے کمائیں۔
میٹا ٹریڈر 4 ڈاؤن لوڈ کریں اور اپنی پہلی ٹریڈ کھولیں۔
  • Grand Choice
    Contest by
    InstaForex
    InstaForex always strives to help you
    fulfill your biggest dreams.
    مقابلہ میں شامل ہوں

تجویز کردہ مضامین

مارچ 26 2025 کو جی بی پی / یو ایس ڈی کے لیے تجزیہ

جی بی پی / یو ایس ڈی کے لیے ویوو کا نمونہ کچھ مبہم لیکن مجموعی طور پر قابل عمل ہے۔ اب بھی طویل مدتی مندی کا رجحان بننے

Chin Zhao 17:53 2025-03-26 UTC+2

یورو / یو ایس ڈی تجزیہ : مارچ 17

یورو / یو ایس ڈی کے لیے 4 گھنٹے کی ویوو کا تجزیہ زیادہ پیچیدہ ڈھانچے میں تبدیل ہونے کا خطرہ ہے۔ 25 ستمبر کو نیچے

Chin Zhao 20:32 2025-03-17 UTC+2

جی بی پی / یو ایس ڈی تجزیہ - 25 فروری: پاؤنڈ میں تنزلی کی کوئی جلدی نہیں ہے

جی بی پی / یو ایس ڈی کے لیے ویوو کا نمونہ مبہم ہے لیکن پھر بھی قابل فہم ہے۔ 1 میں ویوو 2 کے گرد گھومنے والی

Chin Zhao 14:36 2025-02-25 UTC+2

جی بی پی / یو ایس ڈی تجزیہ – 11 فروری: مارکیٹ کو بیلی سے بہت زیادہ توقعات ہیں

جی بی پی / یو ایس ڈی کی ویوو کی ساخت کچھ مبہم ہے لیکن عام طور پر قابل فہم ہے۔ اس بات کا بہت زیادہ امکان

Chin Zhao 16:26 2025-02-11 UTC+2

جنوری 03 2025 کو یورو / یو ایس ڈی کے لیے تجزیہ

یورو / یو ایس ڈی کے لیے 4 گھنٹے کے چارٹ کی لہر کا ڈھانچہ تیزی سے واضح اور دلچسپ ہوتا جا رہا ہے۔ جنوری 2024 سے، میں 16 اپریل

Chin Zhao 14:59 2025-01-06 UTC+2

جی بی پی / یو ایس ڈی میں ویوو کا تجزیہ برائے 30 اکتوبر 2024

اصلاحی ویوو کے ابھی تک کوئی آثار نظر نہیں آئے۔ بدھ کو جی بی پی / یو ایس ڈی میں 15 بیسز پوائنٹ کی کمی کے باوجود، امریکی سیشن

Chin Zhao 18:48 2024-10-30 UTC+2

جی بی پی / یو ایس ڈی کا تجزیہ برائے 02 اکتوبر 2024

جی بی پی / یو ایس ڈی کے لیے ویوو کا نمونہ کافی پیچیدہ ہے اور اس میں توسیع ہوتی رہتی ہے۔ کچھ عرصے کے لیے، ویوو کا ڈھانچہ قائل

Chin Zhao 20:46 2024-10-02 UTC+2

جی بی پی / یو ایس دی تجزیہ - 1 اکتوبر: پاؤنڈ غیر متزلزل رہتا ہے۔

جی بی پی / یو ایس ڈی کے لیے ویوو کا نمونہ کافی پیچیدہ ہے اور تیزی سے توسیع شدہ شکل اختیار کرنا جاری رکھے ہوئے ہے۔ ایک موقع پر،

Chin Zhao 18:12 2024-10-01 UTC+2

ستمبر 25 سے جی بی پی / یو ایس ڈی, اے یو ڈی / یو ایس ڈی, ییو ایس ڈی / سی ایچ ایف, یورو / جے پی وائے, اے یو ڈی / جے پی وائے, یو ایس ڈی انڈیکس، #بِٹ کوائن کے لیے آسان لہر تجزیہ پر مبنی ہفتہ وار پیشن گوئی

اگلے چند دنوں میں، برطانوی پاؤنڈ کے بتدریج ایک طرف کے رجحان میں جانے کی توقع ہے۔ ہفتے کے دوسرے نصف میں، ایک الٹ اور قیمت میں کمی کے آغاز

Isabel Clark 15:01 2024-09-30 UTC+2

یورو / یو ایس ڈی، یوایس ڈی/ جے پی وائے، جی بی پی / جے پی وائے، یو ایس ڈی / سی اے ڈی، این ذیڈ ڈی / یو ایس ڈی، یورو / جی بی پی، اور گولڈ کے لیے سیمپلی فائیڈ تجزیہ پر مبنی ہفتہ وار پیشن گوئی

اگلے چند دنوں کے دوران، یورو ریزسٹنس زون کے ساتھ ساتھ آگے بڑھنے کی توقع ہے۔ اس کے بعد، حالات تبدیل ہو سکتے ہیں اور قیمت میں کمی کا آغاز

Isabel Clark 14:12 2024-09-30 UTC+2
ابھی فوری بات نہیں کرسکتے ؟
اپنا سوال پوچھیں بذریعہ چیٹ.
Widget callback
 

Dear visitor,

Your IP address shows that you are currently located in the USA. If you are a resident of the United States, you are prohibited from using the services of InstaFintech Group including online trading, online transfers, deposit/withdrawal of funds, etc.

If you think you are seeing this message by mistake and your location is not the US, kindly proceed to the website. Otherwise, you must leave the website in order to comply with government restrictions.

Why does your IP address show your location as the USA?

  • - you are using a VPN provided by a hosting company based in the United States;
  • - your IP does not have proper WHOIS records;
  • - an error occurred in the WHOIS geolocation database.

Please confirm whether you are a US resident or not by clicking the relevant button below. If you choose the wrong option, being a US resident, you will not be able to open an account with InstaForex anyway.

We are sorry for any inconvenience caused by this message.