Analysis of GBP/USD 5M
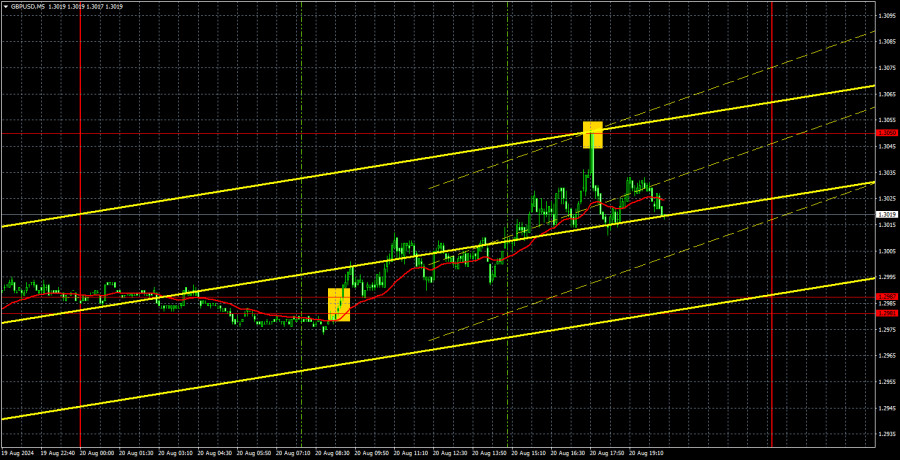
The GBP/USD pair sustained its upward movement throughout Tuesday, showing no sign of a slight downward correction. Thus, the entirely irrational rise of the British currency continues. Although the price slightly bounced off the 1.3050 level, this does not necessarily mean a slight downward correction will begin. The market buys the British pound and sells the dollar continuously, even without fundamental or macroeconomic support.
As we mentioned earlier, it is always possible to explain any movement of the pair in hindsight. Federal Reserve Chair Jerome Powell will speak on Friday, and the market naturally expects only dovish rhetoric from him. However, one can say that this speech is no longer interesting to market participants. Why, when it has already been priced in? If Powell is not sufficiently dovish, the dollar may see a slight rebound from its "Mariana Trench," but this will not stop the market from expecting a rate cut from the Fed in September, November, and December. The timing of the next rate cut by the Bank of England is of no concern to the market, and neither is BoE Governor Andrew Bailey's speech. Despite lower inflation in the UK, the market is anticipating significant monetary policy easing in the US.
On Tuesday, two trading signals were formed, both of which were excellent. First, the pair accurately settled above the 1.2981-1.2987 range, rose to 1.3050, and perfectly bounced off that level. Thus, traders could initially open long positions, which yielded a profit of about 30 pips, and then open short positions, which could also be closed profitably. The pound's decline may continue back to the 1.2981-1.2987 range.
COT report:
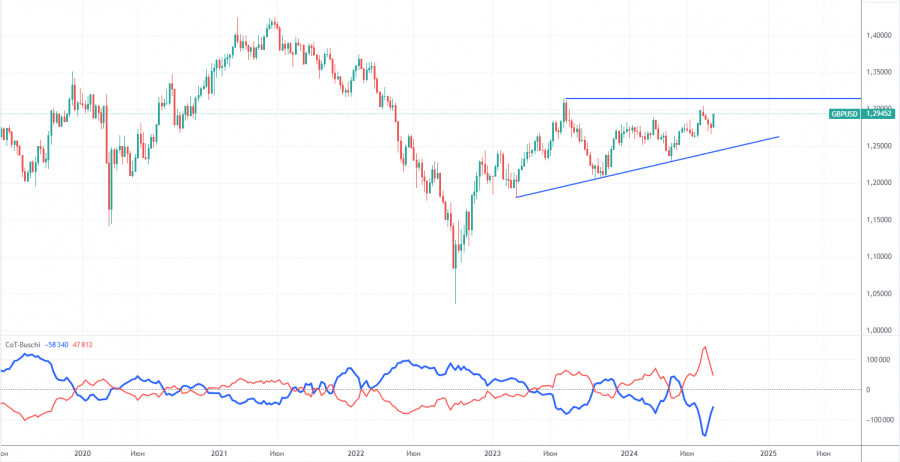
COT reports for the British pound indicate that the sentiment among commercial traders has been constantly changing in recent years. The red and blue lines, representing the net positions of commercial and non-commercial traders, constantly intersect and are often close to the zero mark. According to the latest report on the British pound, the non-commercial group closed 23,500 buy contracts and opened 3,100 short ones. As a result, the net position of non-commercial traders decreased by another 26,600 contracts over the week and continues to fall rapidly. Yet the pound continues to rise calmly.
The fundamental background still does not provide any grounds for long-term purchases of the pound sterling, and the currency has a real chance to resume the global downward trend. However, an ascending trend line formed in the weekly time frame. Therefore, a long-term decline in the pound is unlikely unless the price breaches this trend line. Despite almost everything, the pound continues to rise. Even when COT reports show that major players are selling the pound, it continues to rise. The parade of paradoxes continues.
Analysis of GBP/USD 1H
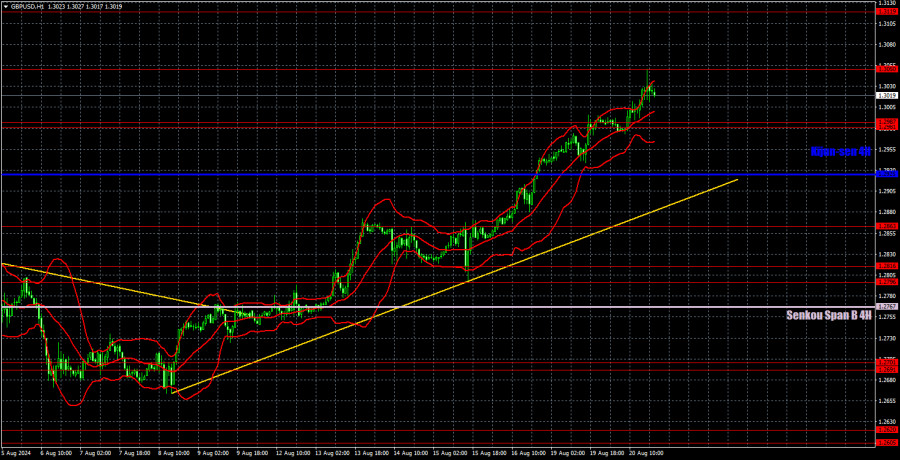
On the hourly chart, GBP/USD shows a strong potential to sustain upward movement. A decline is the only logical and predictable scenario in the medium term when considering all factors: technical, fundamental, and macroeconomic. However, the market's current behavior is to interpret any report, no matter how minor, in favor of the pound, effectively leaving the dollar with no opportunities. This trend is not solely due to macroeconomics but also the market's clear reluctance to buy the dollar, leading to its decline even in the absence of clear triggers.
For August 21, we highlight the following important levels: 1.2429-1.2445, 1.2516, 1.2605-1.2620, 1.2691-1.2701, 1.2796-1.2816, 1.2863, 1.2981-1.2987, 1.3050, 1.3119. The Senkou Span B line (1.2767) and the Kijun-sen line (1.2925) lines can also serve as sources of signals. Setting the Stop Loss to break even when the price moves in the intended direction by 20 pips is recommended. The Ichimoku indicator lines may shift during the day, which should be considered when determining trading signals.
For Wednesday, no significant events are scheduled in the UK, and in the US, only the minutes of the last Fed meeting are expected. The Fed minutes are always a formality, as Powell typically shares all necessary information and decisions with the market. Nevertheless, if the minutes are dovish, the market doesn't need much to continue selling the dollar.
Explanation of illustrations:
Support and resistance levels: Thick red lines near which the trend may end.
Kijun-sen and Senkou Span B lines: These Ichimoku indicator lines, transferred from the 4-hour timeframe to the hourly chart, are strong lines.
Extreme levels: Thin red lines from which the price previously bounced. These provide trading signals.
Yellow lines: Trend lines, trend channels, and other technical patterns.
Indicator 1 on COT charts: The net position size for each category of traders.


