The GBP/USD pair also showed a downward movement on Wednesday, but the pound still fell much less than the euro and rose much more. However, we have been saying this since the beginning of the year. In principle, everything said in the article on EUR/USD also applies to GBP/USD. The pound sterling is rising for no apparent reason, even though the Bank of England first began easing monetary policy, which was almost inconceivable at the beginning of the year. However, this is the objective reality. So why is the pound rising and the dollar falling?
We would not consider the fundamental and macroeconomic background at this point, as current events do not impact market actions or major players. The pound has been rising almost daily for no apparent reason and cannot even start a minor correction. Such an illogical and unjustified movement suggests that a different, more logical trend is about to begin. It will likely coincide with a fundamental background that will leave many traders puzzled about what is happening in the market.
As mentioned before, the macroeconomic and fundamental factors currently have no significance. Any negative report for the dollar is happily processed, while any positive report is ignored. The market is only focused on the FOMC meeting on September 18 and will likely maintain a bullish sentiment until the meeting occurs. However, it's important to note that predicting the end of a trend that has lasted for two years is extremely difficult. If we switch to the weekly time frame, it is clear that we are still in a global downward trend that has been going on for 16 years. Yes, the pair has been rising for the past two years, but we have already explained this – two years ago, the market began to expect the Federal Reserve to soften its monetary policy.
Corrections take much longer than impulsive movements, so we are not surprised that the upward trend (essentially a correction) is ongoing. We did not anticipate such a strong appreciation of the British currency, but it is important to understand that the more the dollar falls now, the stronger it will rise later.
It is also worth noting that, by the standards of the weekly time frame, the pair is crawling upward in 2024. This does not indicate the bulls' strength but rather their weakness. In the 4-hour time frame, the pair has been rising almost daily, but on the weekly chart, the price is barely moving upwards. We have repeatedly mentioned this year that the pair's volatility is very low – the lowest in recent years. Thus, no matter how much the pound rises in the near future, we will still expect it to fall. In the long term, a new phase of the global downtrend will likely begin in the fall of 2024, or even closer to winter, to further confuse retail traders.
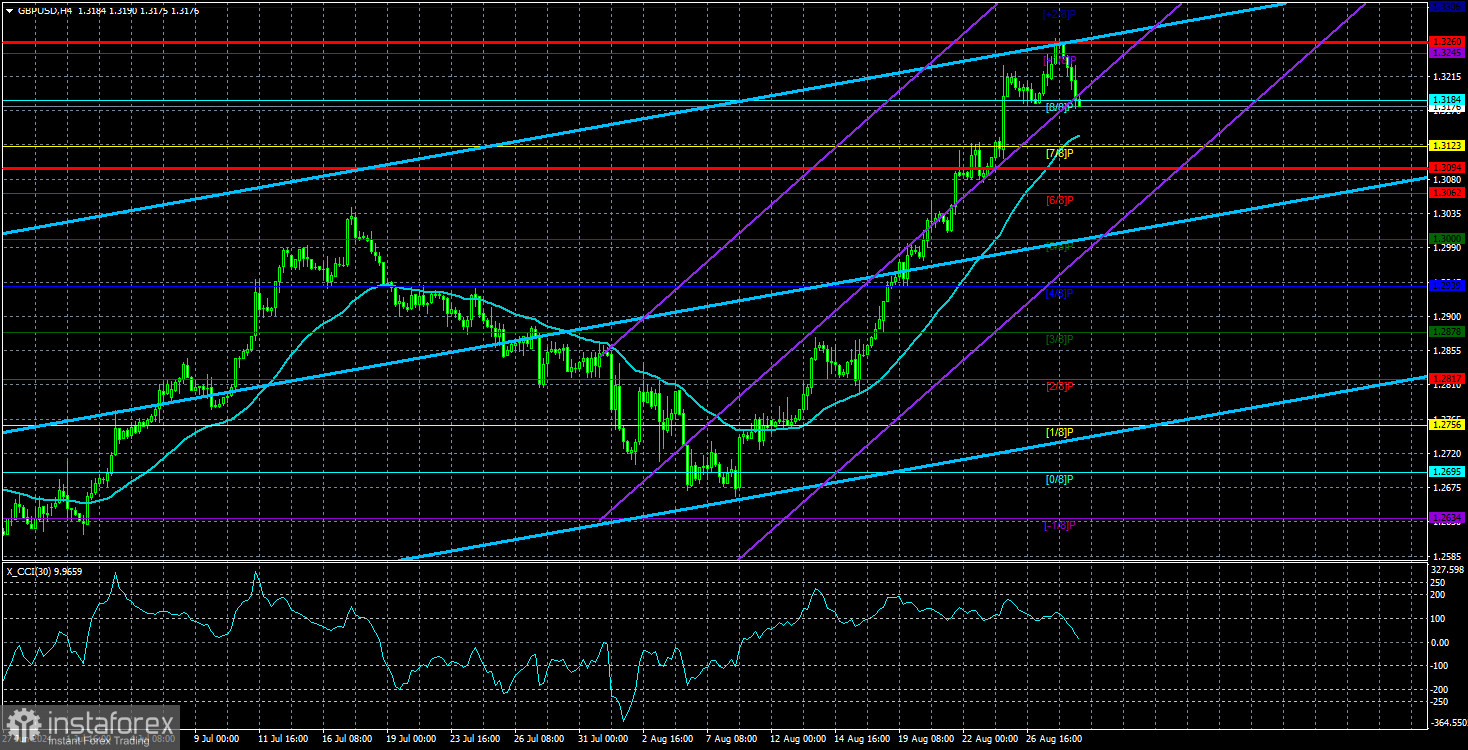
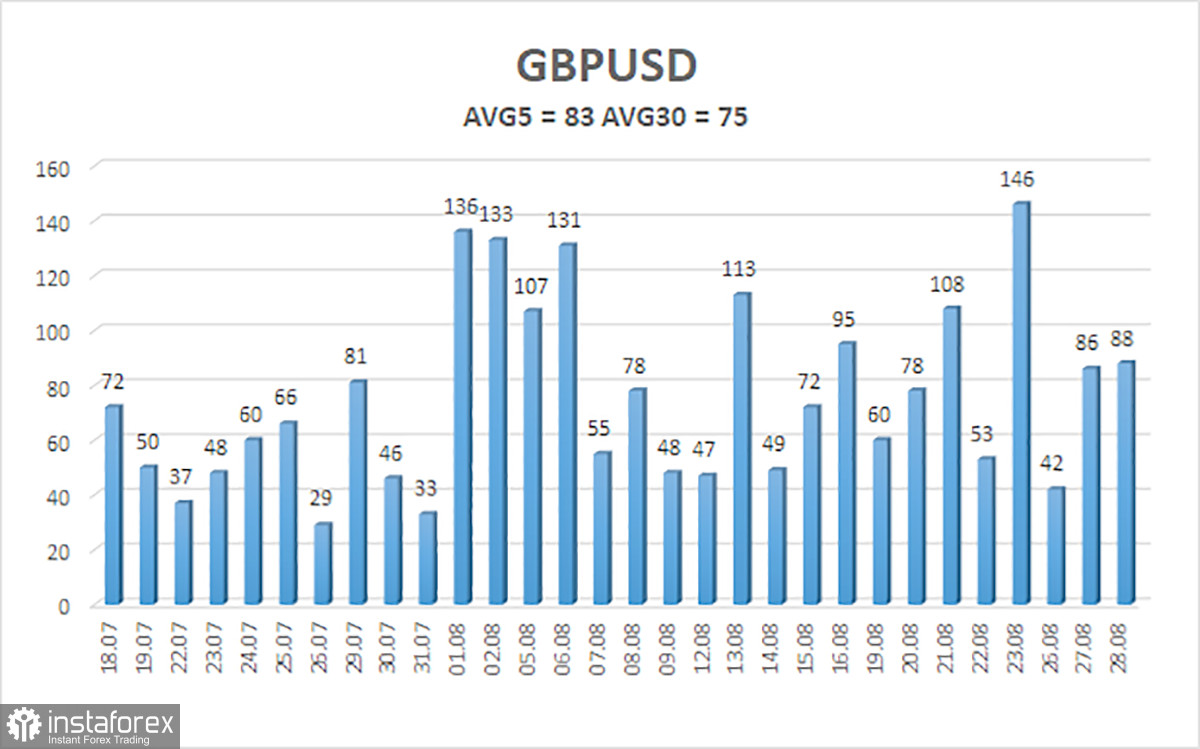
The average volatility of the GBP/USD pair over the past five trading days is 83 pips. For the GBP/USD pair, this value is considered average. On Thursday, August 29, we expect movement within the range bounded by levels 1.3094 and 1.3260. The upper linear regression channel is directed upwards, signaling the continuation of the upward trend. The CCI indicator has formed a triple bearish divergence.
Nearest Support Levels:
- S1 – 1.3184
- S2 – 1.3123
- S3 – 1.3062
Nearest Resistance Levels:
Trading Recommendations:
The GBP/USD pair continues its illogical rise but retains a good chance of resuming a downward momentum. We are not considering long positions at this time, as we believe that the market has already factored in all the bullish factors for the British currency (which are not much) several times. At present, the market continues to buy without any apparent reason. Short positions could be considered, at the very least, after the price settles below the moving average, with targets at 1.2939 and 1.2878. The current movement of the pair has nothing to do with the concepts of "logic" and "pattern."
Explanations for Illustrations:
Linear Regression Channels: help determine the current trend. If both are directed in the same direction, it means the trend is strong at the moment.
Moving Average Line (settings 20,0, smoothed): defines the short-term trend and the direction in which trading should be conducted.
Murray Levels: target levels for movements and corrections.
Volatility Levels (red lines): the probable price channel in which the pair will spend the next 24 hours, based on current volatility indicators.
CCI Indicator: Entering the oversold area (below -250) or the overbought area (above +250) means a trend reversal in the opposite direction is approaching.