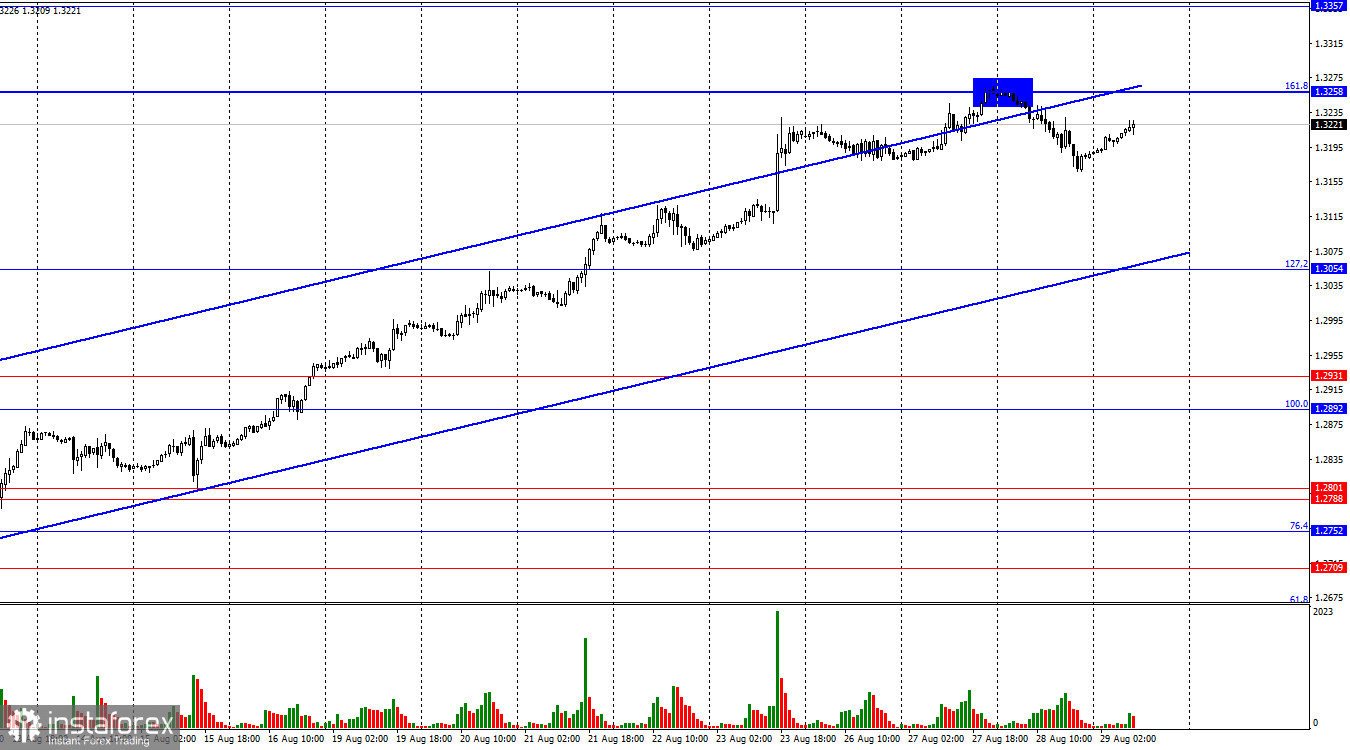
On the hourly chart, the GBP/USD pair rebounded from the 161.8% Fibonacci corrective level at 1.3258 and a reversal in favor of the US dollar.
Thus, the decline in quotes may continue towards the lower boundary of the upward trend channel. In my view, the British pound has needed a downward correction for some time, and the lower boundary of the channel is a likely target. However, it should be noted that the market trend is currently bullish. A consolidation of the pair above the 1.3258 level would suggest further growth for the pound.
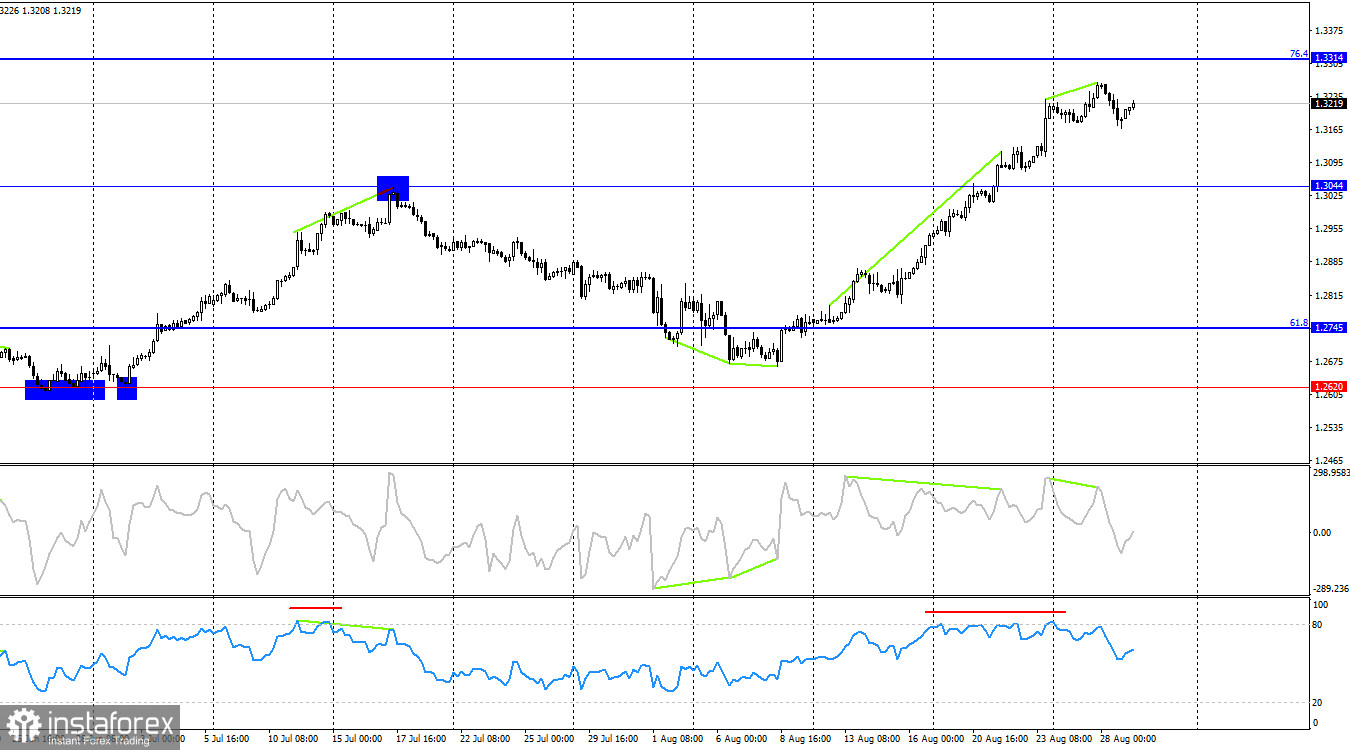
The wave situation is clear. The last completed downward wave failed to break the low of the previous wave, while the last upward wave managed to break the peak of the previous wave. Thus, we are currently dealing with a bullish trend without question, but all the waves are so large that a trend change may only be identified with a significant delay. I simply do not see any internal waves that would indicate a potential trend reversal. However, there is an upward trend channel.
There was no significant information flow on Wednesday, but today the US will release its GDP report for the second quarter. This will be the second preliminary estimate, which could confirm the first one, showing that the US economy grew by 2.8%, much higher than initial forecasts. However, a month ago, traders were relatively unresponsive to the growth of the American economy. There is no reason to expect that they will respond to this report by purchasing dollars today. Nevertheless, the dollar might continue to rise today, if that can be said. After all, we have a good signal around the 1.3258 level, overbought conditions for the pair, and an upward channel where the price has not been for more than two weeks. On the 4-hour chart, we have a whole spectrum of bearish signals in the form of divergences and overbought conditions.
On the 4-hour chart, the pair has consolidated above the 1.3044 level. The CCI indicator has warned of a bearish divergence for over a week, and the RSI indicator has been in overbought territory for a week, which is rare. Thus, I would say that the probability of a decline in the pair in the coming days is high. However, the current consolidation of quotes above the 1.3044 level suggests a continued rise towards the next Fibonacci level at 76.4%—1.3314. The only signal for the pound's decline is on the hourly chart.
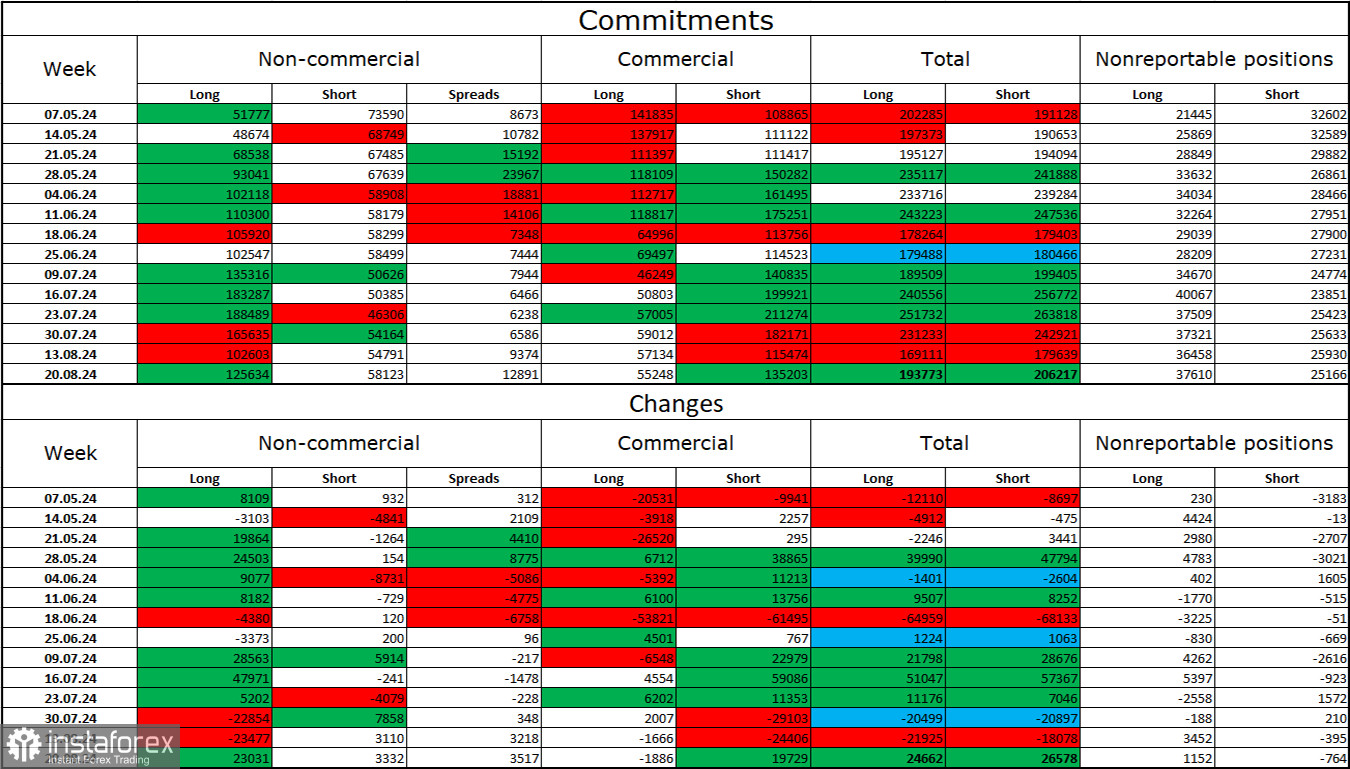
Commitments of Traders (COT) Report:
The sentiment among non-commercial traders turned significantly more bullish in the last reporting week. The number of long positions held by speculators increased by 23,031, while the number of short positions rose by 3,332. Bulls still have a solid advantage. The gap between long and short positions is nearly 67,000: 125,000 versus 58,000.
In my view, the British pound still has potential for a decline, but COT reports suggest otherwise. Over the past 3 months, the number of long positions has risen from 51,000 to 125,000, while the number of short positions has decreased from 74,000 to 58,000. I believe that over time, professional traders will start to offload long positions or increase short positions, as all possible factors for buying the British pound have already been accounted for. However, it should be noted that this is merely an assumption. The graphical analysis suggests a likely decline in the near term, but the current trend remains clearly bullish.
Economic Calendar for the US and UK:
- US – GDP Change for Q2 (12:30 UTC)
- US – Changes in Initial Jobless Claims (12:30 UTC)
On Thursday, the economic calendar contains two entries, which the market may potentially overlook. The influence of the informational background on market sentiment today will be weak.
GBP/USD Forecast and Trading Advice:
Selling the pair was possible upon a rebound from the 1.3258 level on the hourly chart, targeting 1.3054. Purchases could be initiated upon a close above the 1.3054 level, targeting 1.3258. This target has been reached. I would not rush into new purchases even if the price closes above the 1.3258 level.
Fibonacci levels are drawn from 1.2892 to 1.2298 on the hourly chart and from 1.4248 to 1.0404 on the 4-hour chart.