جمعرات کو، یورو/امریکی ڈالر کی جوڑی نے اپنی کمی کو برقرار رکھا اور موونگ ایوریج لائن سے نیچے ترتیب پایا۔ بغیر کسی مجبوری وجوہات یا بنیادوں کے مسلسل دوسرے دن یورو گر گیا۔ یاد رہے کہ حالیہ مہینوں اور یہاں تک کہ پچھلے سال بھی صورتحال بالکل برعکس تھی۔ عام طور پر، یورو ظاہری وجوہات یا بنیادوں کے بغیر بڑھے گا۔ ہم پہلے ہی اس مسئلے پر بات کر چکے ہیں۔ سال کے آغاز سے، ہم نے تاجروں کو نشاندہی کی ہے کہ یورو کا اضافہ اکثر غیر منطقی ہوتا ہے۔ مارکیٹ سال کے آغاز سے فیڈرل ریزرو کی شرح میں کمی کی توقع کر رہی ہے، اور اس توقع کو ڈالر کی شرح مبادلہ میں شامل کیا گیا ہے۔ تاہم، قریب سے جانچنے پر، ہم نے یہ نتیجہ اخذ کیا ہے کہ مارکیٹ دو سالوں سے ایف ای ڈی ریٹ میں کٹوتی کر رہی ہے۔ 2022 کے موسم گرما میں، امریکی افراط زر میں کمی آنے لگی، اور ایک ماہ بعد، امریکی ڈالر کی طویل کمی شروع ہوئی۔
اگر مارکیٹ کسی بھی منطق کی پیروی کرتی ہے، تو امریکی مانیٹری پالیسی میں نرمی کے چکر کے آغاز کے ساتھ ہی، ڈالر بھی طویل عرصے تک بڑھے گا۔ مزید برآں، یورپی مرکزی بینک، جس کی مانیٹری پالیسی شروع میں بہت نرم تھی، بھی اپنی شرح کو کم کر رہا ہے۔ چونکہ گزشتہ دو سالوں میں صرف یورو میں اضافہ ہوا ہے، ہمیں یقین ہے کہ مارکیٹ نے ابھی تک ECB کی پالیسی میں نرمی پر کارروائی نہیں کی ہے۔ لہذا، پہلے کی طرح، ہم صرف یورو/امریکی ڈالر کے جوڑے میں کمی کی توقع کرتے ہیں، قیمت کی برابری کا ہدف غیر حقیقی نہیں لگتا۔
یہ کہنا کسی حد تک بولی ہے کہ اس ہفتے ایک نیا طویل مدتی رجحان شروع ہوا ہے۔ اگلے جمعہ کو امریکی لیبر مارکیٹ اور بے روزگاری کے بارے میں رپورٹس شائع کی جائیں گی، اور اگر مارکیٹ ایسی قدریں دیکھتی ہے جو اسے پسند نہیں ہیں، تو امریکی ڈالر دوبارہ گر سکتا ہے۔ مارکیٹ ممکنہ طور پر ایف ای ڈی سے 18 ستمبر کو شرحوں میں 0.5 فیصد کمی کی توقع کرے گی اور اس منظر نامے پر ردعمل ظاہر کرے گی۔ یاد رکھیں کہ مہینے کے آغاز میں، مارکیٹ کو ایسی ہی توقعات تھیں اور اس کی قیمت فوری طور پر 50 پوائنٹ کی شرح میں کمی تھی۔ پھر، اس کی توقعات میں نرمی آئی، لیکن اس سے ڈالر کے لیے آسانیاں پیدا نہیں ہوئیں۔ اس طرح یورو کی قیمت بڑھ رہی ہے۔ مارکیٹ فیڈ سے سب سے زیادہ توقع رکھتی ہے، اس لیے وہ اس مفروضے سے مایوس ہو جاتا ہے، لیکن ڈالر اپنی اصل پوزیشن پر واپس نہیں آتا۔
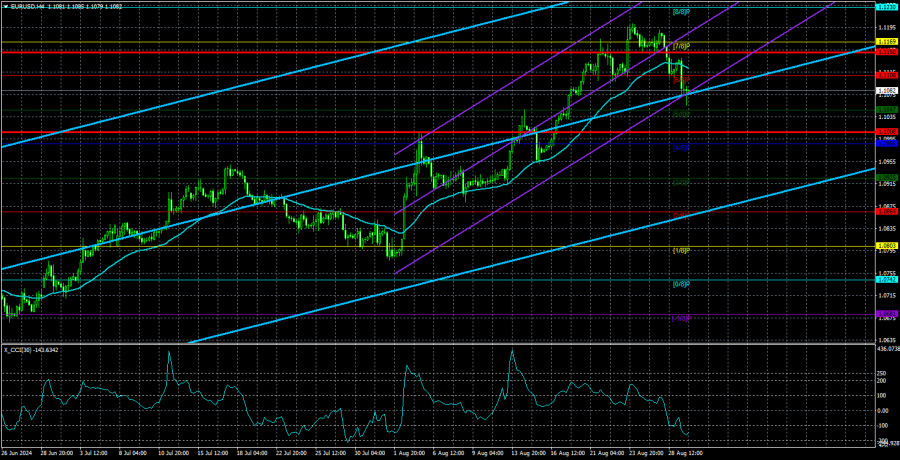
جو کچھ ہم نے حالیہ دنوں میں دیکھا ہے وہ ایک نئے اوپر کی طرف حرکت کے مرحلے سے پہلے کی اصلاح ہو سکتی ہے۔ ہمارا ماننا ہے کہ اگر مارکیٹ حقیقی طور پر ایک یا دو ماہ کے لیے جوڑی خریدنے کے لیے تیار ہے، تو کم از کم اصلاح صرف 100 پِپس کی بجائے نمایاں ہونی چاہیے۔ یہ بات قابل غور ہے کہ CCI انڈیکیٹر تین بار زیادہ خریدے گئے علاقے میں داخل ہوا ہے اور اس نے نصف درجن مندی کا فرق دکھایا ہے۔ کیا اس کے نتیجے میں کم از کم اصلاح تو نہیں ہونی چاہیے؟ اگرچہ، یہ ایک بیاناتی سوال ہے۔ اگر امریکہ اگلے ہفتے کمزور اعداد و شمار دکھاتا ہے، تو ڈالر واپس کھائی میں گر سکتا ہے۔ دوسری طرف، اگر اعداد و شمار معمولی ہیں لیکن ڈالر بڑھتا ہے، تو یہ اس بات کی نشاندہی کر سکتا ہے کہ اوپر کی طرف غیر منطقی رجحان ختم ہو رہا ہے۔

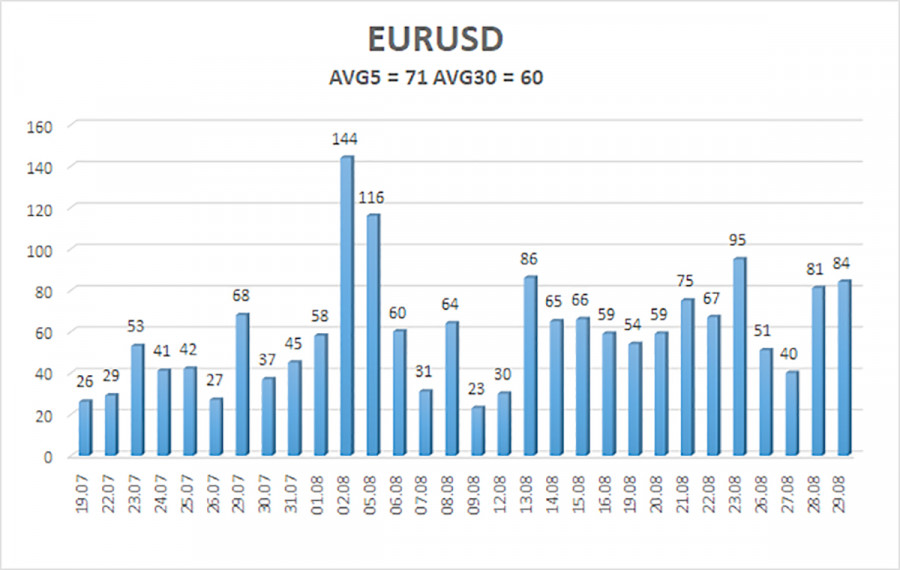
30 اگست تک گزشتہ پانچ تجارتی دنوں میں یورو/امریکی ڈالر کا اوسط اتار چڑھاؤ 71 پپس ہے، جسے اوسط سمجھا جاتا ہے۔ ہم توقع کرتے ہیں کہ جوڑی جمعہ کو 1.1008 اور 1.1150 کی سطح کے درمیان چلے گی۔ اوپری لکیری ریگریشن چینل اوپر کی طرف ہے، لیکن عالمی نیچے کی طرف رجحان برقرار ہے۔ CCI انڈیکیٹر تین بار زیادہ خریدے ہوئے علاقے میں داخل ہوا، جو کہ ممکنہ کمی کے رجحان کی طرف اشارہ کرتا ہے اور اس بات کو نمایاں کرتا ہے کہ موجودہ اضافہ کس طرح غیر منطقی ہے۔
قریبی سپورٹ کی سطحیں:
S1 – 1.1047
S2 – 1.0986
S3 – 1.0925
قریبی مزاحمت کی سطحیں:
R1 – 1.1108
R2 – 1.1169
R3 – 1.1230
تجارتی تجاویز:
یورو/امریکی ڈالر کا جوڑا یورو خریدنے اور ڈالر فروخت کرنے کی مارکیٹ کی انتھک خواہش کی وجہ سے اپنی مضبوط اوپر کی حرکت جاری رکھے ہوئے ہے۔ پچھلے جائزوں میں، ہم نے ذکر کیا کہ ہم صرف درمیانی مدت میں یورو سے کمی کی توقع کرتے ہیں، لیکن موجودہ اضافہ اب تقریباً ایک مذاق کی طرح لگتا ہے۔ مارکیٹ خریداری کے ہر موقع سے فائدہ اٹھانا جاری رکھے ہوئے ہے، لیکن تکنیکی تصویر اپ ٹرینڈ ختم ہونے کے اعلی امکان کے بارے میں خبردار کرتی ہے۔ شارٹ پوزیشنز پر غور کیا جا سکتا ہے، کیونکہ قیمت اس ہفتے موونگ ایوریج سے بمشکل کم ہوئی ہے، جس کے اہداف 1.1047 اور 1.0986 ہیں۔ نیچے کی طرف کم و بیش اہم حرکت دیکھنے کا موقع ہے۔
تصاویر کی وضاحتیں:
لکیری ریگریشن چینلز: موجودہ رجحان کا تعین کرنے میں مدد کریں۔ اگر دونوں ایک ہی سمت میں ہیں، تو اس کا مطلب ہے کہ رجحان اس وقت مضبوط ہے۔
موونگ ایوریج لائن (ترتیبات 20,0، ہموار): مختصر مدت کے رجحان اور اس سمت کی وضاحت کرتی ہے جس میں ٹریڈنگ کی جانی چاہیے۔
مرے لیولز: حرکات اور اصلاح کے لیے ہدف کی سطح۔
اتار چڑھاؤ کی سطحیں (سرخ لکیریں): قیمت کا ممکنہ چینل جس میں جوڑا اگلے 24 گھنٹے گزارے گا، موجودہ اتار چڑھاؤ کے اشارے کی بنیاد پر۔
سی سی آئی انڈیکیٹر: اوور سیلڈ ایریا (-250 سے نیچے) یا زیادہ خریدا ہوا ایریا (+250 سے اوپر) میں داخل ہونے کا مطلب ہے کہ مخالف سمت میں رجحان کو تبدیل کرنا قریب آ رہا ہے۔


