Analysis of EUR/USD 5M
On Tuesday, the EUR/USD pair edged lower again. We cannot say this was due to macroeconomic data, as the only somewhat important report of the day—the ISM Services Sector Index in the U.S.—was mediocre in significance. Nevertheless, the euro should generally move downward, as its current positions are unreasonably high. Therefore, we welcome any fall in the EUR/USD pair.
Unfortunately, there will be enough U.S. reports this week that could pressure the dollar. The first report on business activity (which had the highest hopes) showed weaker figures than forecasted. We have talked about this many times. If, at the maximum Federal Reserve rate, the market or experts expect crazy growth, such forecasts will never be met. Consequently, the dollar will continue to have no macroeconomic support. Until Friday, the U.S. currency may still balance at more or less acceptable values, but another collapse is possible on Friday.
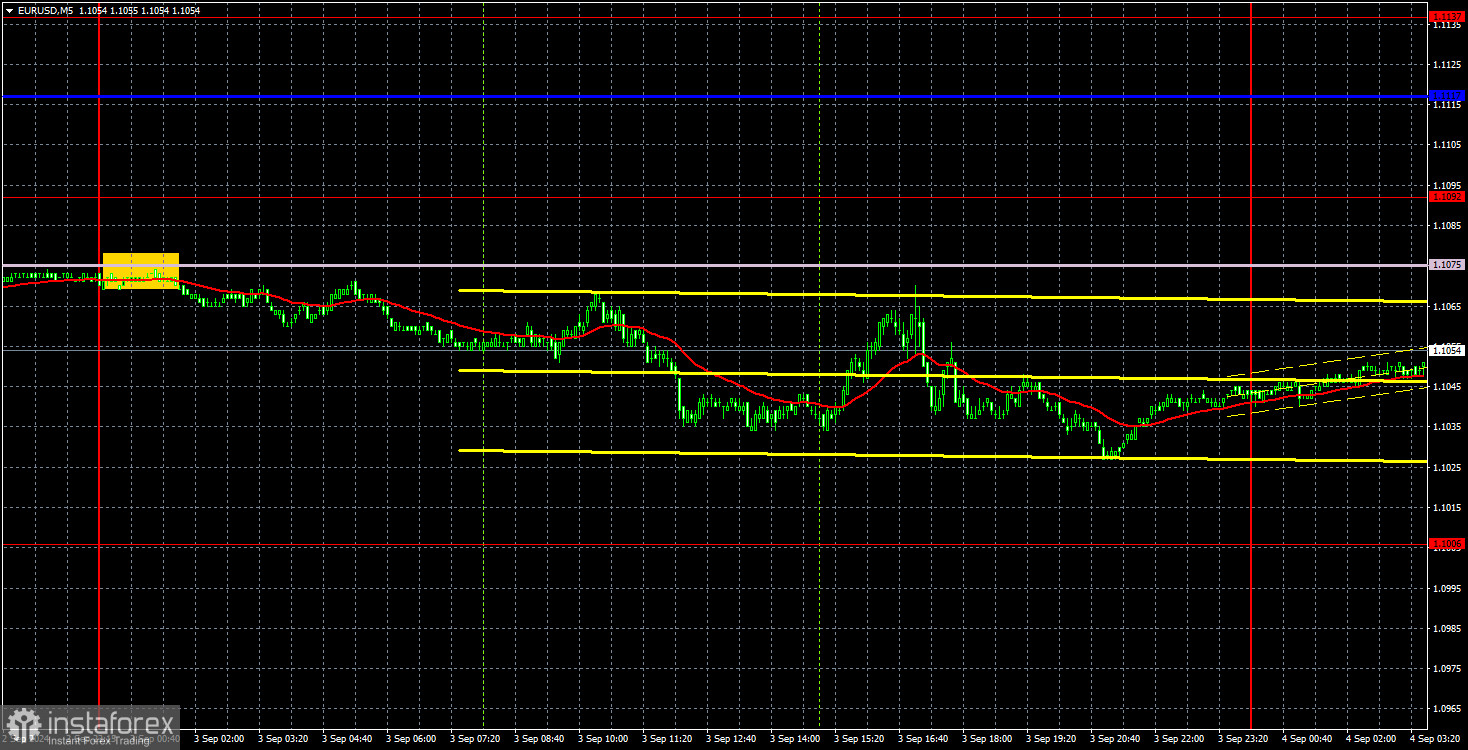
From yesterday's trading signals, we can note the rebound from the Senkou Span B line, which occurred overnight. At the opening of the European session, the price had moved 12 pips away from the formation point, but the day before, the price had rebounded from this line. Therefore, traders could open short positions. As of Wednesday morning, the price had not reached the nearest target level and is moving back to the Senkou Span B line. It is not advisable to count on a rapid dollar strengthening right now.
COT report:
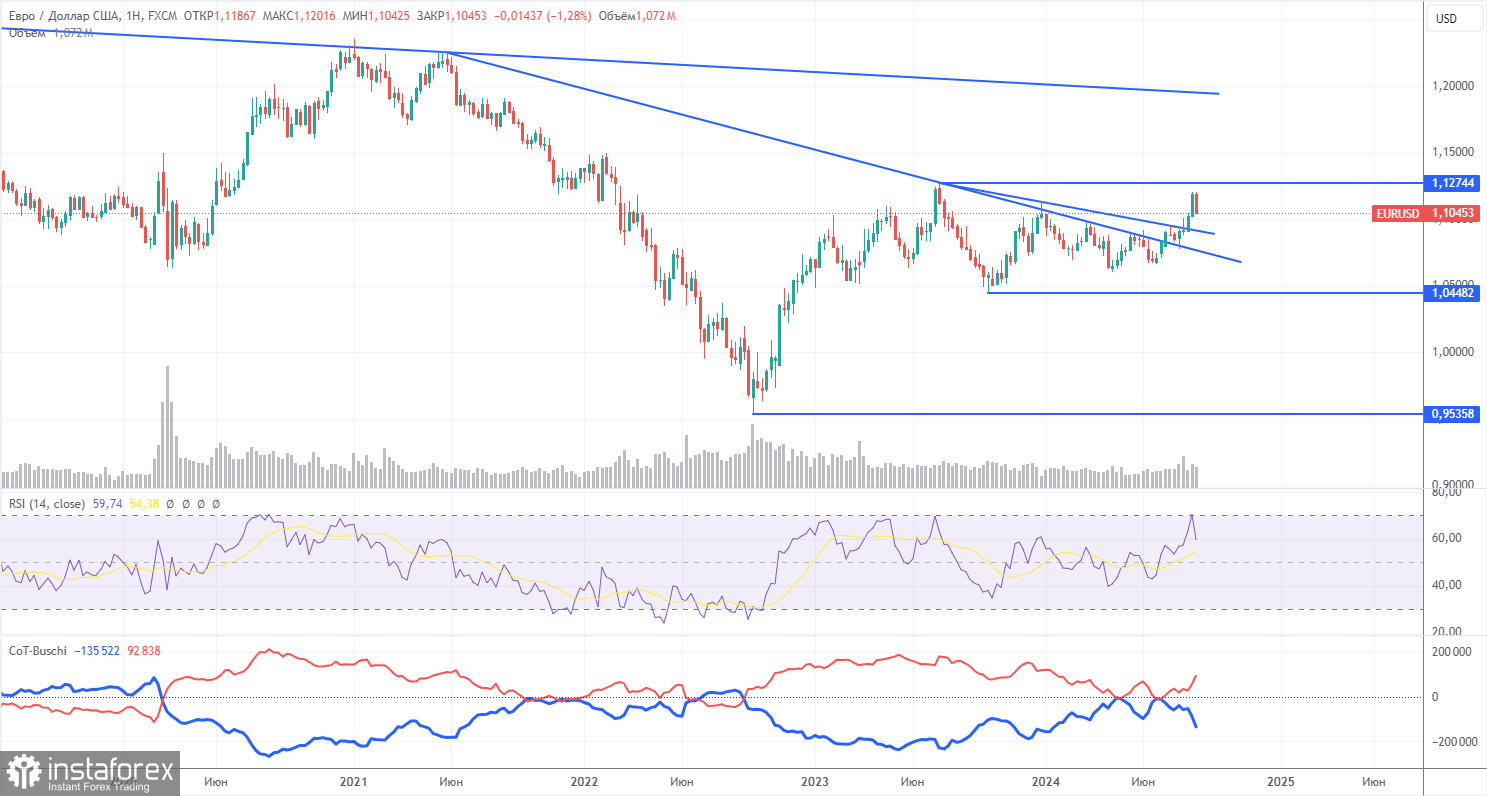
The latest COT report dated August 27 shows that the net position of non-commercial traders has long been bullish and remains so. The bears' attempt to take over failed spectacularly. The net position of non-commercial traders (red line) declined in the second half of 2023 and the first of 2024, while that of commercial traders (blue line) has grown. Currently, professional players are again increasing their long positions.
We also still do not see any fundamental factors supporting the strengthening of the euro, and technical analysis indicates that the price is in a consolidation phase—in other words, a flat. In the weekly time frame, it is clear that since December 2022, the pair has been trading between levels 1.0448 and 1.1274. In other words, we have moved from a seven-month flat into an 18-month one.
At the moment, the red and blue lines are slightly moving away from each other, which indicates that long positions on the single currency are increasing. However, such changes cannot be the basis for long-term conclusions within a flat market. During the last reporting week, the number of long positions in the non-commercial group increased by 24,000, while the number of short positions decreased by 12,800. Accordingly, the net position increased by 36,800. Yet, there is still potential for the euro to fall.
Analysis of EUR/USD 1H
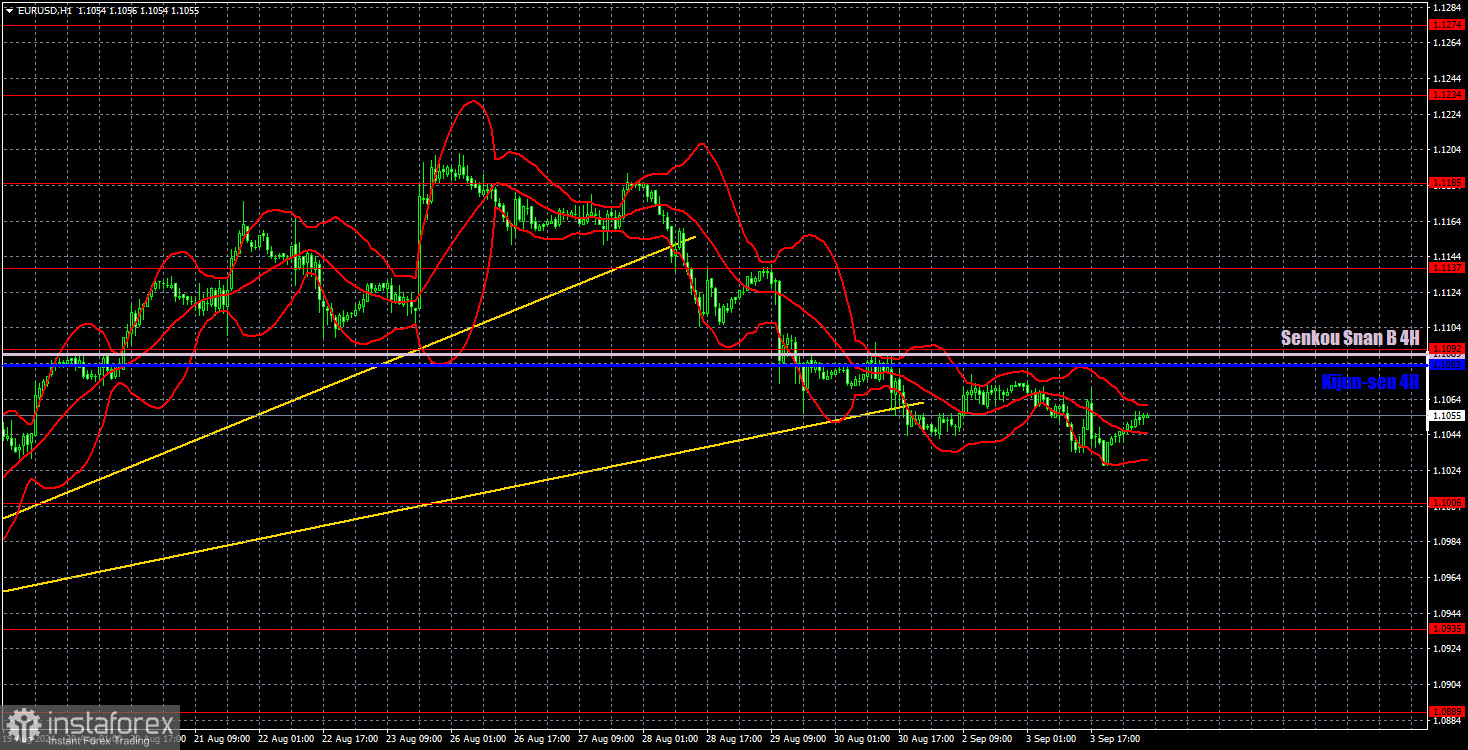
In the hourly time frame, the EUR/USD pair finally has a real chance to end the unjustified upward trend. The price has overcome the Senkou Span B and Kijun-sen lines and two trend lines. With two weeks until the Fed meeting, the market could very well resume unrestrained selling of the U.S. dollar, but at least now, there are technical grounds to expect a drop in the pair. If the U.S. labor market and unemployment data do not disappoint this time, the dollar will continue to rise.
For September 4, we highlight the following levels for trading: 1.0658-1.0669, 1.0757, 1.0797, 1.0843, 1.0889, 1.0935, 1.1006, 1.1092, 1.1137, 1.1185, 1.1234, 1.1274, as well as the Senkou Span B (1.1089) and Kijun-sen (1.1083) lines. The Ichimoku indicator lines can move during the day, so this should be considered when identifying trading signals. Remember to set a Stop Loss to break even if the price has moved in the intended direction by 15 pips. This will protect you against potential losses if the signal turns out to be false.
Only the release of the service sector business activity index in its second estimate for August is scheduled for Wednesday in the European Union. In the U.S., a more significant JOLTs report on the number of job openings is due. As usual, the market does not expect a low value.
Explanation of illustrations:
Support and resistance levels: Thick red lines near which the trend may end.
Kijun-sen and Senkou Span B lines: These Ichimoku indicator lines, transferred from the 4-hour timeframe to the hourly chart, are strong lines.
Extreme levels: Thin red lines from which the price previously bounced. These provide trading signals.
Yellow lines: Trend lines, trend channels, and other technical patterns.
Indicator 1 on COT charts: The net position size for each category of traders