Analysis of GBP/USD 5M
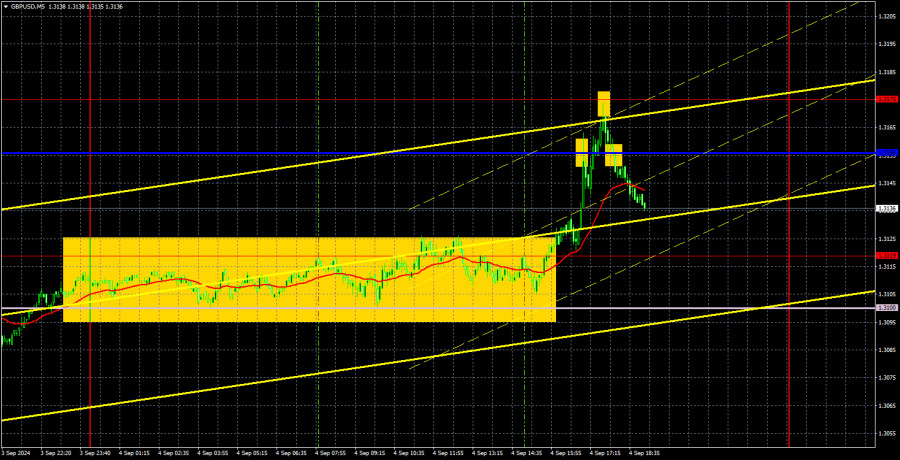
During Wednesday, the GBP/USD pair also traded with noticeable gains. At least Wednesday's rise was much stronger than the decline on Monday or Tuesday. Yesterday, the US published a July report on the number of job openings (JOLTS). Despite the known increase in unemployment for the month, none of the experts and forecasters seemed to expect a decrease in job openings. Therefore, the actual value turned out to be lower than expected. And this became a reason for new sales of the US dollar. Such opportunities are not being squandered by the market right now.
As a result, we saw a new decline in the US dollar, which might not have happened and should not have happened. But what can you do when all forecasts for key macroeconomic indicators are overstated? After all, you can't even blame market participants — the actual JOLTS value was weaker than expected, and the ISM manufacturing business activity index remained below 50.0. This is how all reports are being processed at the moment. The British pound has been correcting for over a week but failed to consolidate below the Senkou Span B line. Overcoming the trend line under current circumstances means practically nothing. The GBP/USD pair could quickly soar on Thursday and Friday.
The price remained in one place throughout the European trading session. Only in the US session, after the release of the JOLTS report, did the upward movement begin. Traders could have taken advantage of it, and the movement ended near the Kijun-sen line and the level of 1.3175. Short positions could also be opened from these two resistances, but macroeconomic data from the US on Thursday and Friday could easily trigger another rise in the pair.
COT report:
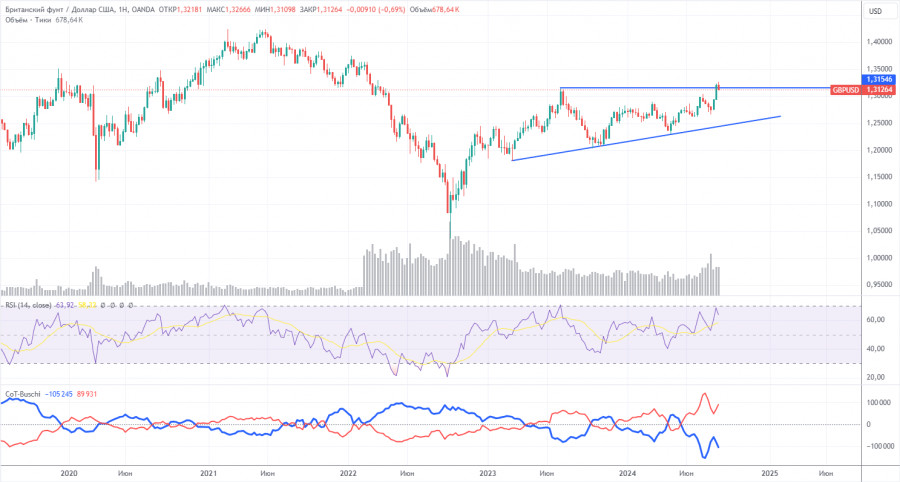
The COT reports for the British pound indicate that the sentiment of commercial traders has been subject to frequent changes in recent years. The red and blue lines, representing the net positions of commercial and non-commercial traders, are constantly intersecting and often close to the zero mark. We also see that the last downward trend occurred when the red line was below zero. Therefore, a downturn could be expected around the level of 1.3154, but this assumption will need regular confirmation over time.
According to the latest report on the British pound, the non-commercial group opened 26,500 buy contracts and 4,100 short ones. As a result, the net position of non-commercial traders increased by 22,400 contracts over the week, but overall, it is still rising rather than falling.
The fundamental background still does not provide any grounds for long-term purchases of the pound sterling, and the currency has a real chance to resume the global downward trend. However, an ascending trend line formed in the weekly time frame. Therefore, a long-term decline in the pound is unlikely unless the price breaches this trend line. Despite almost everything, the pound continues to rise. Even when COT reports show that major players are selling the pound, it continues to rise.
Analysis of GBP/USD 1H
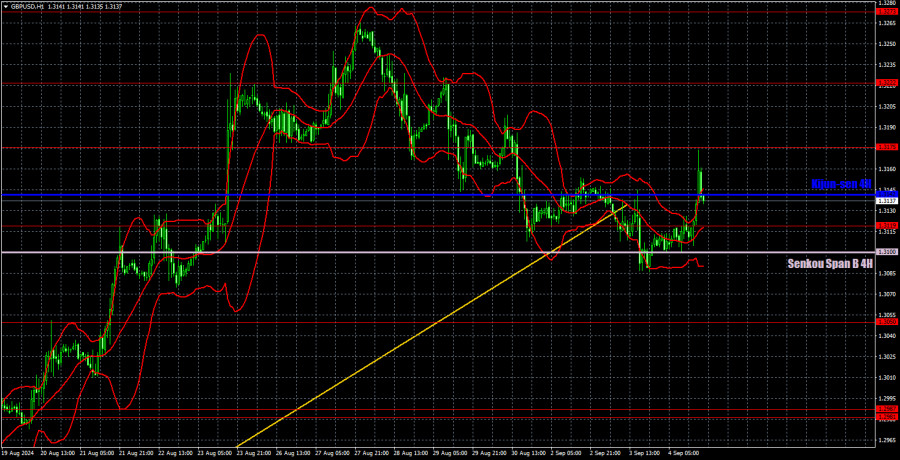
In the hourly time frame, GBP/USD continues to correct, but this correction could end at any moment. A decline is the only consistent and logical scenario in the medium term, considering all factors: technical, fundamental, and macroeconomic. However, the market buys pounds and sells dollars, disregarding the lack of corrections or news on specific days. Moreover, economic reports from overseas are once again mediocre, and under such conditions, it will take much work for the dollar to sustain its growth.
For September 5, we highlight the following important levels: 1.2605-1.2620, 1.2691-1.2701, 1.2796-1.2816, 1.2863, 1.2981-1.2987, 1.3050, 1.3119, 1.3175, 1.3222, 1.3273, 1.3367. The Senkou Span B (1.3100) and Kijun-sen (1.3142) lines can also serve as sources of signals. Setting the Stop Loss to break even when the price moves in the intended direction by 20 pips is recommended. The Ichimoku indicator lines may shift during the day, which should be considered when determining trading signals.
For Thursday in the UK, a secondary report of the business activity index in the construction sector is scheduled in its second estimate. In the US, important reports such as the ADP and ISM in the services sector are due, along with secondary ones, such as unemployment benefit claims and the S&P services sector business activity index.
Explanation of illustrations:
Support and resistance levels: Thick red lines near which the trend may end.
Kijun-sen and Senkou Span B lines: These Ichimoku indicator lines, transferred from the 4-hour timeframe to the hourly chart, are strong lines.
Extreme levels: Thin red lines from which the price previously bounced. These provide trading signals.
Yellow lines: Trend lines, trend channels, and other technical patterns.
Indicator 1 on COT charts: The net position size for each category of traders.


