EUR/USD
Brief analysis:
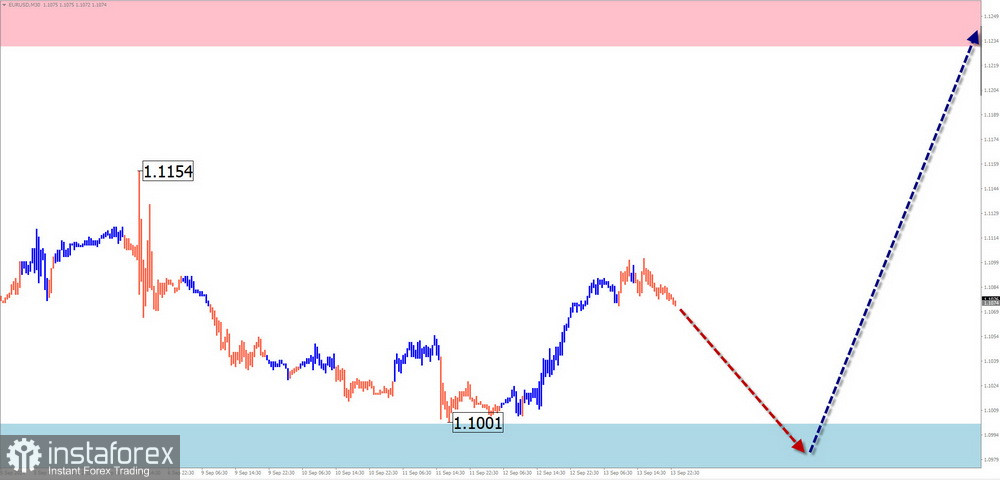
The euro has been in an upward trend since mid-April this year. This trend is aligned with the daily timeframe. In late August, the price reached the lower boundary of a significant reversal zone. Over the past few weeks, the price has been in a corrective phase.
Weekly forecast:
During the first part of the upcoming week, a sideways movement near support levels is expected. Towards the weekend, there is a higher likelihood of increased volatility, a reversal, and renewed price growth up to resistance levels.
Potential Reversal Zones:
- Resistance: 1.1230/1.1280
- Support: 1.1000/1.0950
Recommendations:
- Selling: Limited potential; it is advisable to reduce position sizes.
- Buying: Can be considered after appropriate signals appear near the support area.
USD/JPY
Brief analysis:
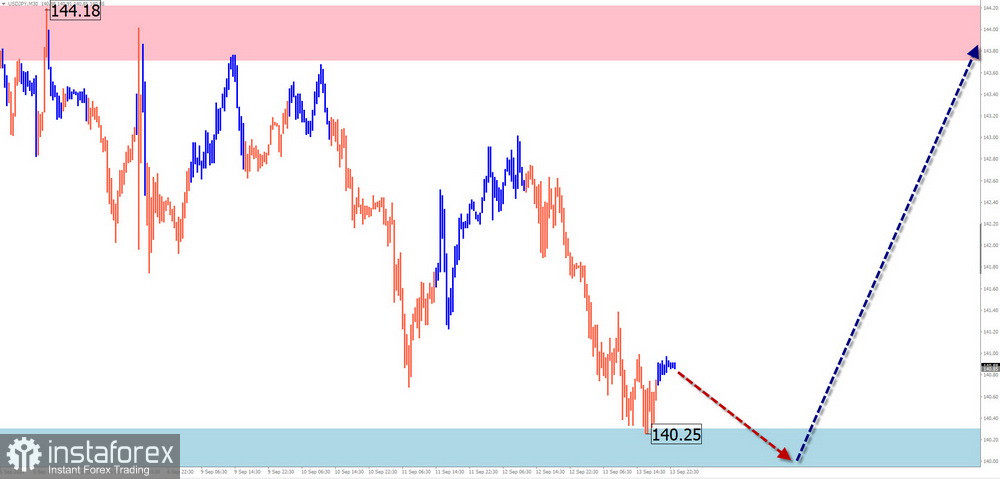
The short-term uptrend in the yen pair, which began on August 5, is still developing. This wave has a high level, approaching the daily timeframe. A corrective wave (B) is currently in progress, and no clear reversal signals have formed yet.
Weekly forecast:
The upcoming week is expected to feature mostly flat, sideways movement along the support zone. Towards the weekend, increased activity and renewed price growth are possible. A brief decline below the support boundary cannot be ruled out.
Potential Reversal Zones:
- Resistance: 143.70/144.20
- Support: 140.30/139.80
Recommendations:
- Selling: High risk and could lead to losses.
- Buying: Consider only after confirmed signals appear near the support area in your trading strategy.
EUR/CHF
Brief analysis:
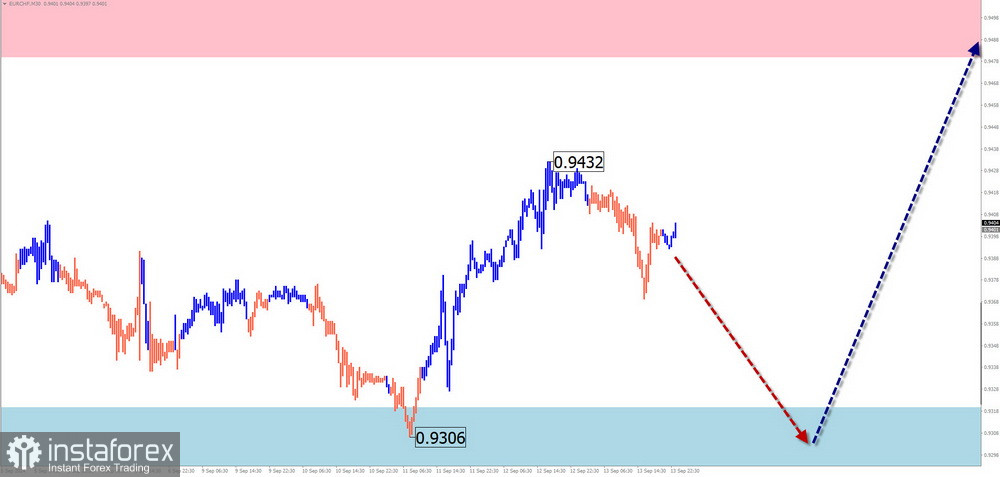
The euro against the Swiss franc has been moving lower for the past four months. A rising wave started on August 5 from the upper boundary of a significant support zone. Its corrective phase has kept the pair near the upper boundary of this zone, but it has not yet completed.
Weekly forecast:
A continuation of the sideways movement is expected, with a more likely downward trend towards the support zone. After a flat period, a reversal and renewed price growth are expected towards the weekend. The resistance levels suggest the likely upper boundary of the weekly range.
Potential Reversal Zones:
- Resistance: 0.9480/0.9530
- Support: 0.9320/0.9270
Recommendations:
- Selling: Limited potential; small positions are possible during individual sessions.
- Buying: Premature until confirmed reversal signals appear near the resistance zone.
EUR/GBP
Brief analysis:
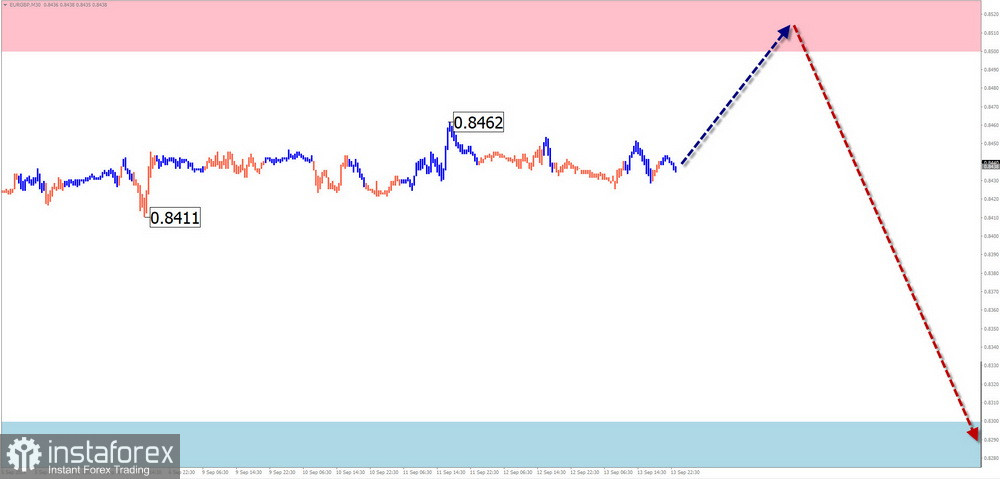
The euro against the British pound has been in a downward horizontal trend since September of the year before last. The final wave (C) began forming in early August. Over the past three weeks, the price has been in a narrow channel, forming a correction, which remains incomplete.
Weekly forecast:
A continuation of the sideways movement is expected. In the next few days, an upward trend towards resistance levels is possible. Towards the weekend, the direction may shift, and the downward movement will resume. A breakout from the current price channel is unlikely.
Potential Reversal Zones:
- Resistance: 0.8500/0.8550
- Support: 0.8300/0.8250
Recommendations:
- Selling: Consider after confirmed signals from your trading strategy in the support zone.
- Buying: Limited potential; possible for intraday trading with reduced position sizes.
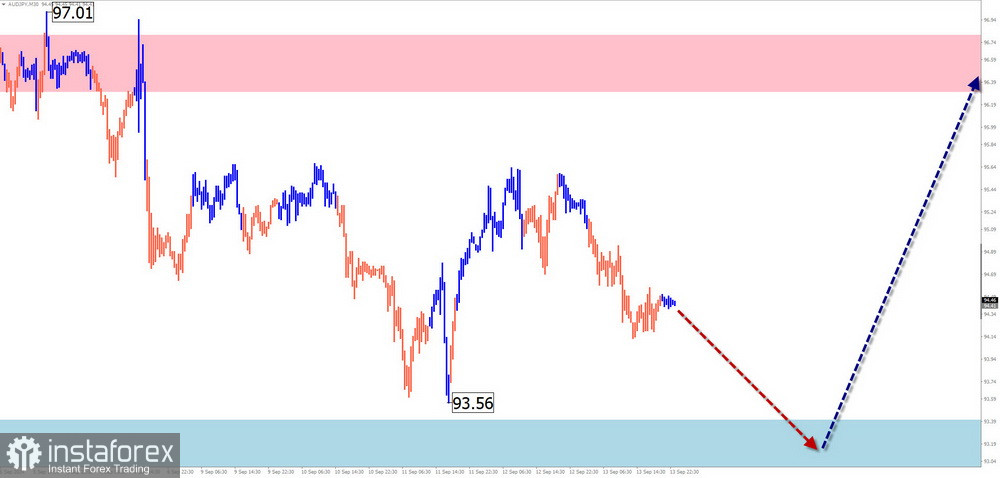
AUD/JPY
Brief analysis:
The unfinished upward wave in the AUD/JPY pair has been in progress since early August. Over the past three weeks, a corrective phase has developed. The upper level of a significant reversal zone has become a support base for an intermediate correction, after which the price is expected to continue rising.
Weekly forecast:
In the upcoming days, the price is likely to continue moving sideways along the support zone. By the end of the week, a reversal and a return to bullish movement are expected. A brief decline below the support boundary cannot be ruled out.
Potential Reversal Zones:
- Resistance: 96.30/96.80
- Support: 93.40/92.90
Recommendations:
- Selling: Possible during individual trading sessions with reduced position sizes.
- Buying: Not recommended until confirmed signals appear near the support zone.
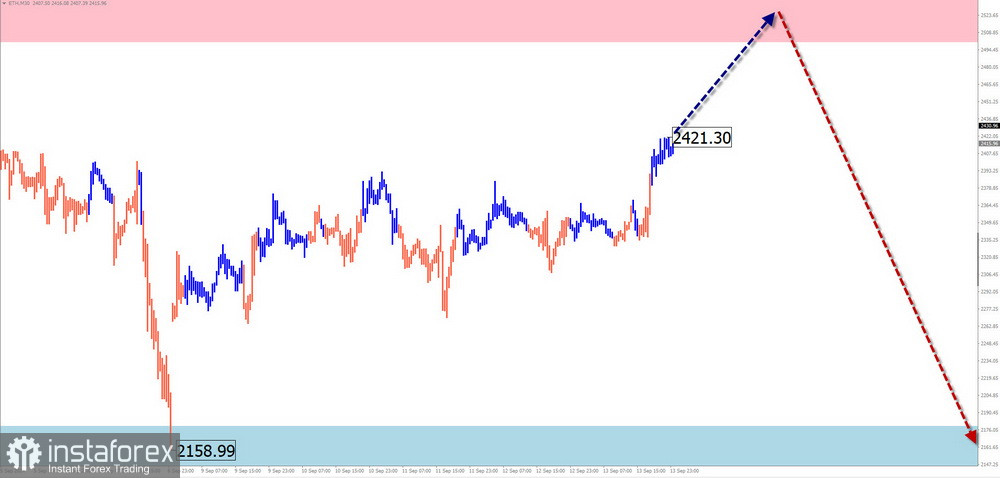
Ethereum
Brief analysis:
Ethereum prices have been declining for most of this year. However, since early August, the trend has shifted upward. The upward wave is primarily developing in a sideways pattern. Analysis shows the formation of a mid-wave (B). Over the past month, growth has been replaced by sideways movement along the lower boundary of a previously breached support level, now acting as resistance.
Weekly forecast:
In the coming days, the price is expected to continue its sideways movement, likely with an upward trend. The second half of the week may see increased volatility, with a possible change in direction and a resumption of price declines.
Potential Reversal Zones:
- Resistance: 2500.0/2550.0
- Support: 2180.0/2130.0
Recommendations:
- Selling: Consider after confirmed signals near the resistance zone.
- Buying: High risk and could lead to losses.
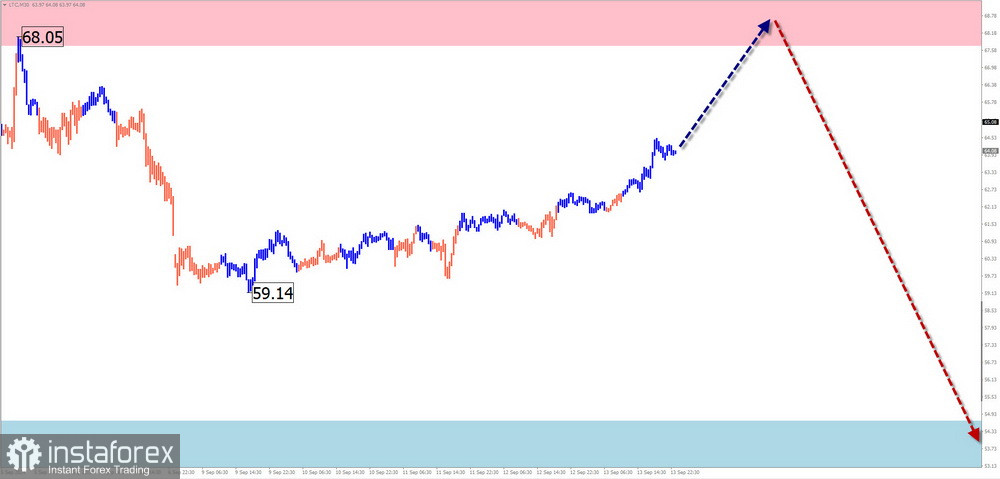
Litecoin
Brief analysis:
Litecoin's period of weakening has come to an end. An upward wave with reversal potential began in early August. After a period of growth, a flat correction has been forming since mid-August, which remains incomplete. The upper boundary of the reversal zone has become strong support, limiting the correction's range.
Weekly forecast:
In the coming days, the most likely scenario is continued sideways movement in a horizontal price channel. A bullish trend is more probable. Towards the end of the week, there is an increased chance of volatility, a change in direction, and a resumption of price declines.
Potential Reversal Zones:
- Resistance: 67.70/69.70
- Support: 54.70/52.70
Recommendations:
- Buying: Possible during individual sessions with reduced position sizes.
- Selling: Not recommended until confirmed reversal signals appear near the resistance zone in your trading systems.
Explanation: In simplified wave analysis (SWA), all waves consist of 3 parts (A-B-C). The last incomplete wave is analyzed at each timeframe. Dashed lines represent expected movements.
Note: The wave algorithm does not take into account the duration of movements over time.