Analysis of Monday's Trades:
1H Chart of the EUR/USD Pair
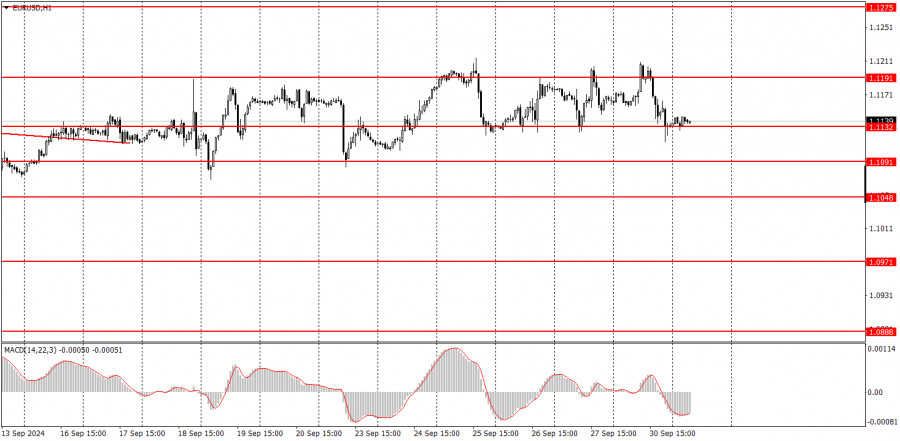
The EUR/USD currency pair continued to trade in a flat pattern on Monday. Previously, we highlighted the channel 1.1091–1.1191, but now the price is more likely within the 1.1132–1.1191 range. In other words, the flat has narrowed and is located at its highest levels in recent months. As usual, the pair failed to make a proper correction, even though the US dollar unexpectedly received support from Jerome Powell yesterday. The Federal Reserve chair stated that the labor market has cooled off recently but remains generally stable and poses no concerns. The economy is growing at a good pace, and inflation is declining, as expected by the central bank. These statements made it clear to the market that the likelihood of a 0.5% rate cut in November is slim. However, even this more hawkish information didn't help the dollar break the upward trend. We only saw another minor pullback, and that too within an absolute flat. This week, a vast amount of important information will come from the US, and the market will decide on its own the chances of a 0.5% rate cut in November based on this data.
5M Chart of the EUR/USD Pair
Several trading signals were formed in the 5-minute time frame on Monday. First, the pair broke through the 1.1189–1.1191 area, but this buy signal was false. The next signal was a reversal around the same area, after which the pair dropped to the 1.1132–1.1140 area, where profits could have been taken on the short position. The bounce from this area could also have been acted upon, but it did not yield much profit – the trade closed at breakeven. The last signal formed too late to act on it.
How to Trade on Tuesday:
In the hourly time frame, the EUR/USD pair still has a chance to form a downward trend, but these chances continue to diminish before our eyes under constant pressure from the bulls. Unfortunately, the illogical selling of the dollar can easily continue in the medium term, as no one knows how much longer the market will be pricing in the Fed's monetary easing and ignoring all factors in favor of the dollar. In the last couple of weeks, it has become noticeable that market participants are finding it difficult to push the pair further upward. We may be nearing the end of the uptrend, but there are important US reports to watch this week.
On Tuesday, trading can be conducted from the 1.1132–1.1140 area, approximately in the middle of the horizontal channel 1.1091–1.1191. However, movements within the flat can be quite erratic.
In the 5-minute time frame, the levels to consider are 1.0726–1.0733, 1.0797–1.0804, 1.0838–1.0856, 1.0888–1.0896, 1.0940, 1.0971, 1.1011, 1.1048, 1.1091, 1.1132–1.1140, 1.1189–1.1191, 1.1275–1.1292. On Tuesday, inflation data for September will be released in the Eurozone, and in the US, the ISM Manufacturing PMI and JOLTs Job Openings reports will be published. Today is also expected to be quite volatile, but the pair remains within the flat.
Basic Rules of the Trading System:
1) Signal Strength: The strength of a signal is determined by the time it takes to form (bounce or break through a level). The less time it takes, the stronger the signal.
2) False Signals: If two or more trades are opened near a certain level based on false signals, all subsequent signals from that level should be ignored.
3) Flat Market: In a flat market, any pair can generate numerous false signals or none at all. In any case, it's better to stop trading at the first signs of a flat market.
4) Trading Timeframe: Trades should be opened between the start of the European session and the middle of the American session, after which they should be closed manually.
5) MACD Indicator Signals: In the hourly time frame, it is preferable to trade based on MACD signals only when there is good volatility and a trend confirmed by a trendline or trend channel.
6) Close Levels: If two levels are located too close to each other (between 5 and 20 pips), they should be considered as a single support or resistance area.
7) Stop Loss: Once the price moves 15 pips in the intended direction, a Stop Loss should be set at the breakeven point.
What's on the Charts:
Support and Resistance Price Levels: These levels serve as targets when opening buy or sell positions. They can also be used as points to set Take Profit levels.
Red Lines: These represent channels or trend lines that display the current trend and indicate the preferred trading direction.
MACD Indicator (14,22,3): The histogram and signal line serve as an auxiliary indicator that can also be used as a source of trading signals.
Important Speeches and Reports (always found in the news calendar) can significantly impact the movement of a currency pair. Therefore, trading should be done with maximum caution during their release, or you may choose to exit the market to avoid a sharp price reversal against the preceding movement.
For Beginners Trading on the Forex Market: It's essential to remember that not every trade will be profitable. Developing a clear strategy and practicing money management is key to achieving long-term success in trading.


