EUR/USD 5-Minute Analysis
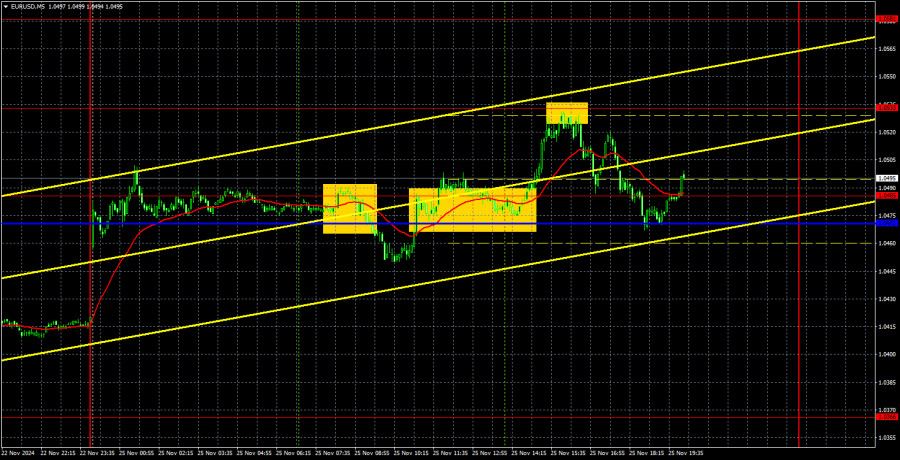
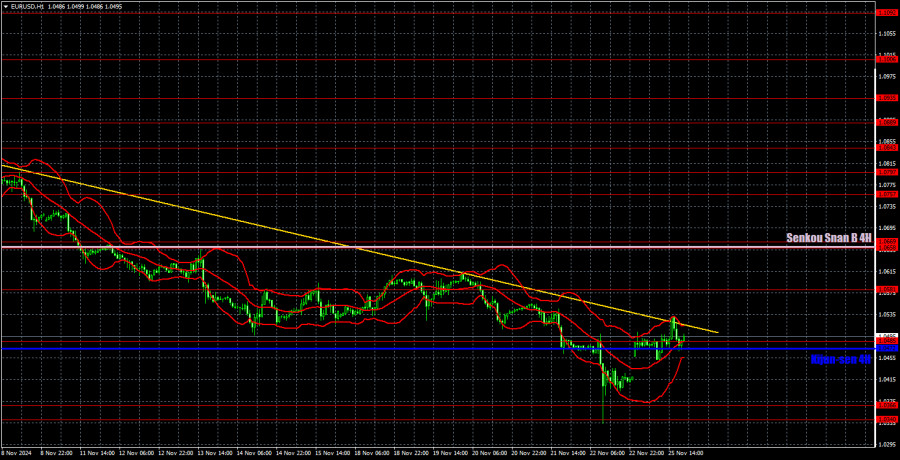
On Monday, the EUR/USD currency pair began a new wave of correction—or, more precisely, a pullback. Yesterday's upward movement does not qualify as a full correction. The price failed to consolidate above the trendline, and Monday's gap suggests that the euro might head downward again. Despite the euro's 150-pip rise, we still believe the downtrend remains intact. This trend persists across all timeframes, even the hourly chart. If the price consolidates above the trendline, we might expect stronger growth, but achieving this will require significant effort. For now, we maintain that further decline is more likely.
No significant reports or events occurred on Monday in the Eurozone or the US, so there was virtually nothing to analyze throughout the day. With the new week, European Central Bank and Federal Reserve representatives resumed their speeches, but for now, they serve merely as background noise for traders. The main factors driving price movements remain unchanged; we mention them almost daily. Nothing has shifted. Only technical factors could support the euro, which would require breaking through the trendline.
There were three notable trading signals on Monday. First, the price consolidated below the 1.0471–1.0485 area, but this signal was false. Next, a buy signal emerged near the same area, resulting in the price reaching the nearest target at 1.0533. Finally, a rebound from the 1.0533 level allowed opening short positions, after which the price returned to the critical line area. As a result, two out of the three trades were profitable.
COT Report
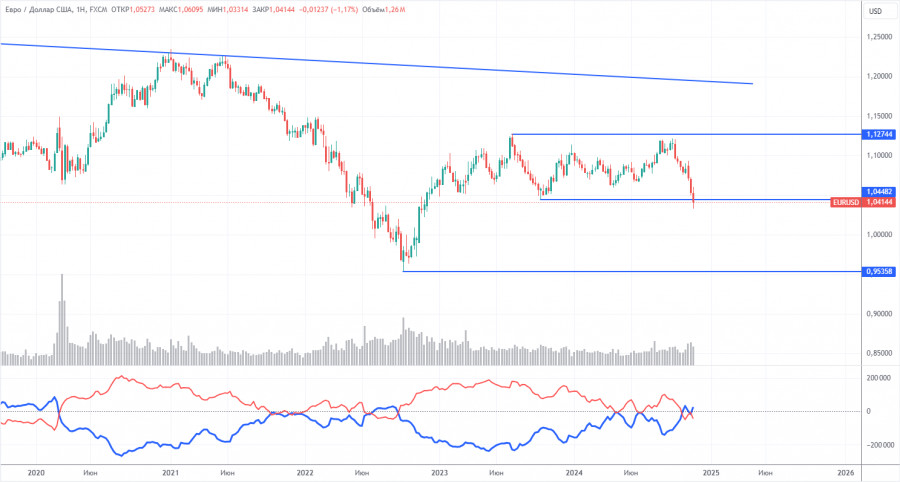
The latest COT (Commitment of Traders) report, dated November 19, shows that non-commercial traders' net position has been bullish for a long time, though bears are gradually gaining dominance. A month ago, the number of short positions held by professional traders surged, flipping the net position negative for the first time. This indicates that the euro is now being sold more frequently than bought.
We still see no fundamental factors supporting the euro's strength, and technical analysis suggests the pair is stuck in a consolidation phase—or, simply put, a flat trend. The weekly timeframe shows that the pair has been trading between 1.0448 and 1.1274 since December 2022. This makes further declines even more likely, and a break below 1.0448 would open the door for more significant losses.
Currently, the red and blue lines in the COT chart have crossed, reversing their positions relative to one another. During the last reporting week, the number of long positions in the non-commercial group decreased by 5,700, while short positions increased by 29,400. As a result, the net position fell by an additional 35,100 contracts.
EUR/USD 1-Hour Analysis
On the hourly timeframe, the pair continues to form a downtrend. There is no point in discussing the fundamental and macroeconomic reasons for a medium-term decline in the dollar, as they are still nonexistent. In the medium term, we expect nothing but further decline. Every day, it becomes increasingly clear that the market has fully priced in the entire cycle of the Fed's monetary easing, and now the Fed is in no hurry to cut rates further, which has already been accounted for. The euro can only hope for a correction, but even a small upward correction is proving difficult.
For November 26, we highlight the following trading levels: 1.0269, 1.0340–1.0366, 1.0485, 1.0581, 1.0658–1.0669, 1.0757, 1.0797, 1.0843, 1.0889, 1.0935, as well as the Senkou Span B line (1.0658) and Kijun-sen line (1.0472). The Ichimoku indicator lines may shift during the day, which should be considered when determining trading signals. Remember to set a Stop Loss order to break even if the price moves 15 pips in the right direction. This helps safeguard against potential losses if the signal turns out to be false.
On Tuesday, the Eurozone calendar is empty, while the U.S. will release the latest Fed meeting minutes. We consider this event of secondary importance. Typically, these minutes do not contain any critical information, and the market reaction is often minimal or nonexistent.
Illustration Explanations:
- Support and Resistance Levels (thick red lines): Key areas where price movement might stall. Not sources of trading signals.
- Kijun-sen and Senkou Span B Lines: Ichimoku indicator lines transferred from the H4 timeframe to the hourly chart, serving as strong levels.
- Extreme Levels (thin red lines): Points where the price has previously rebounded. They can serve as trading signal sources.
- Yellow Lines: Trendlines, channels, or other technical patterns.
- Indicator 1 on COT Charts: Reflects the net position size of each trader category


