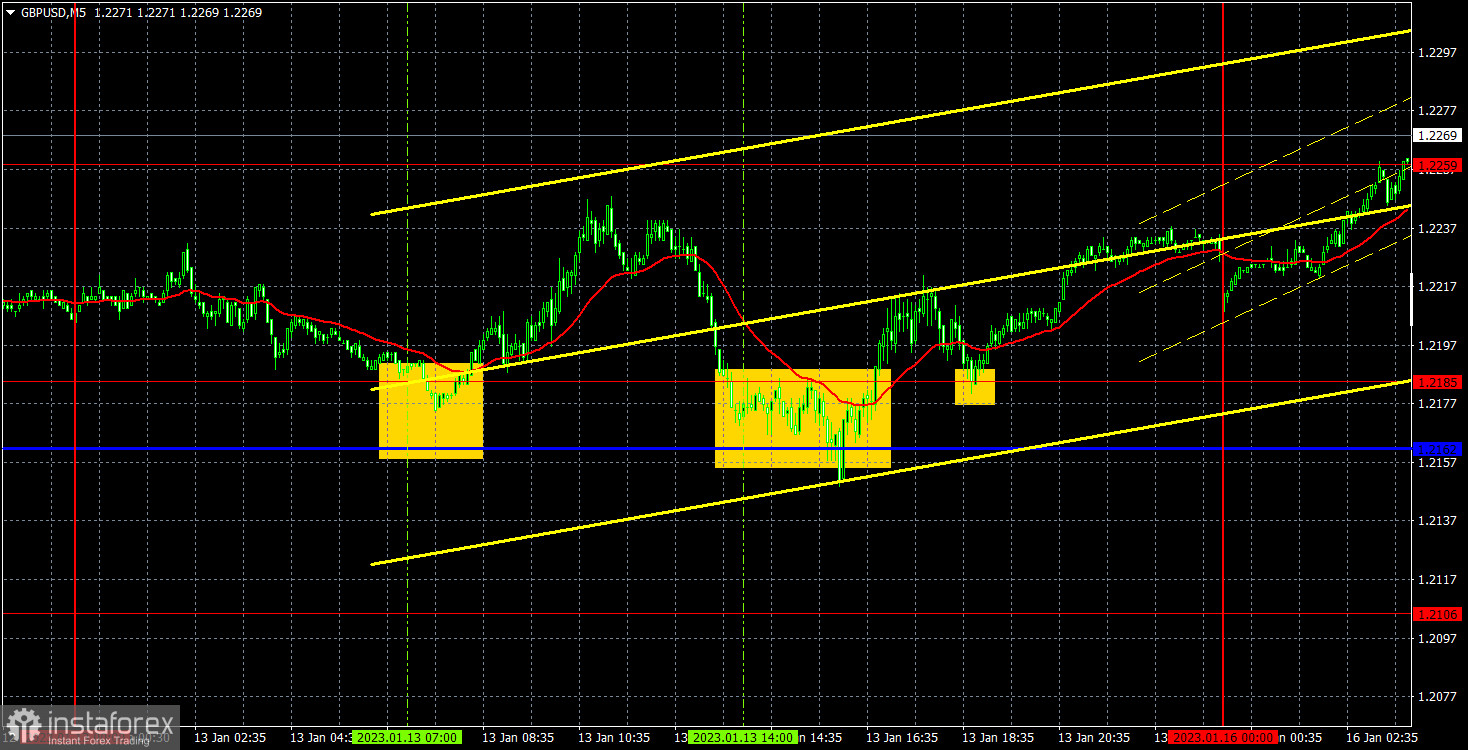
M5 chart of GBP/USD
GBP/USD also maintained an upward trend on Friday. The price tried to cross the area of the critical line, but failed both times. The pound has good chances to rise at the beginning of a new week. The British currency had a reason to rise on Friday. At least during the European session. GDP rose in November not decline as experts expected and this report was enough for the pair to rise. The US Consumer Sentiment Index was stronger than expected, but this report was not interesting for traders, as it was in favor of the dollar. We might have already gotten used to it over the last months. Thus, the pound is aiming for a new round of upward movement, which resumed after Friday, right when trading started on Monday. We already said in our fundamental articles, that the "fundamentals" of the current week are more likely to support the pound than the dollar. Technically, the correction is still possible, but there are no sell signals, so it is not worth selling the pair.
Friday trading signals were not the best, but not the worst either. The price rebounded from 1.2162-1.2185 twice, and then went up from 22 to 52 pips. Accordingly, when opening long positions, a Stop Loss should have been set to Breakeven. The pair did not reach the nearest target level of 1.2259 so traders did not make any profit or loss on any of the open trades.
COT report
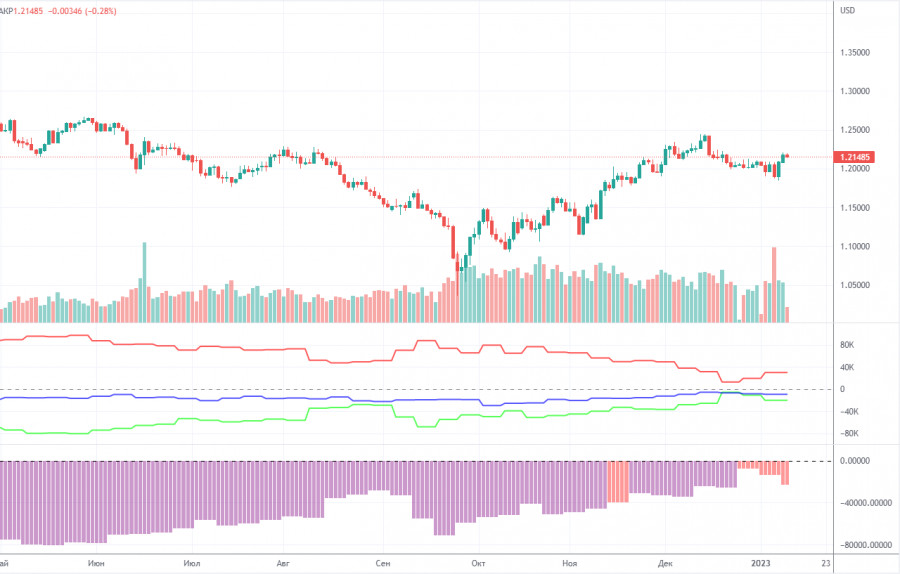
The latest COT report showed an increase in bearish sentiment. During the given period, non-commercial traders closed 7,600 long positions and opened as many as 1,500 short positions. Thus, the net position fell by about 9,100. This figure has been on the rise for several months, and the sentiment may become bullish in the near future, but it hasn't yet. Although the pound has grown against the dollar for the last few months, from a fundamental perspective, it is difficult to answer why it keeps rising. On the other hand, it could fall in the near future (in the mid-term prospect) because it still needs a correction. In general, in recent months the COT reports correspond to the pound's movements so there shouldn't be any questions. Since the net position is not even bullish yet, traders may continue to buy the pair over the next few months. Non-commercial traders now hold 36,000 long positions and 65,500 short ones. I remain skeptical about the pound's long term growth, though there are technical reasons for it. At the same time, fundamental and geopolitical factors signal that the currency is unlikely to strengthen significantly.
H1 chart of GBP/USD
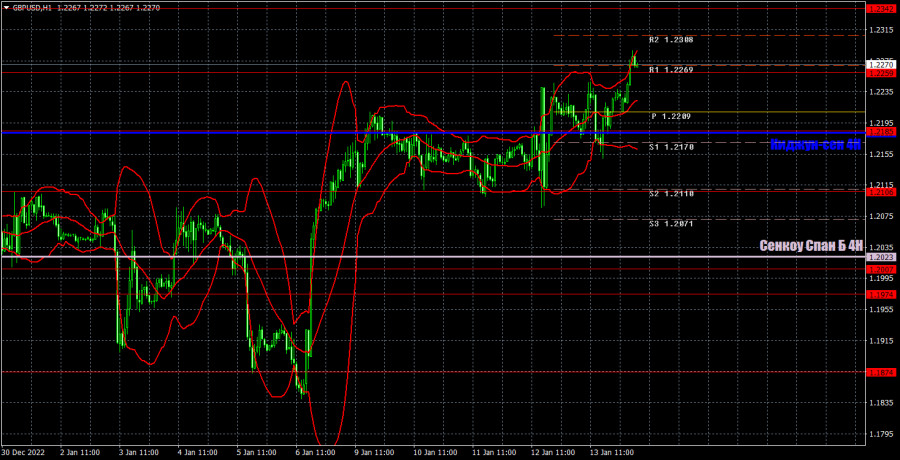
On the one-hour chart, GBP/USD continues to grow, located above the lines of the Ichimoku indicator. At this time it would be possible to form a trend line or a channel, but they would have too strong slope angle, so we believe that it is better to orient on the lines of Kijun-sen and Senkou Span B. On January 16, the pair may trade at the following levels: 1.1974-1.2007, 1.2106, 1.2185, 1.2259, 1.2342, 1.2429-1.2458, 1.2589. The Senkou Span B (1.2023) and Kijun Sen (1.2182) lines may also generate signals. Pullbacks and breakouts through these lines may produce signals as well. A Stop Loss order should be set at the breakeven point after the price passes 20 pips in the right direction. Ichimoku indicator lines may move during the day, which should be taken into account when determining trading signals. In addition, the chart does illustrate support and resistance levels, which could be used to lock in profits. On Monday, there are no important events in the UK and US, but the Asian trading session has already shown that the market is ready to buy even without any fundamental and macroeconomic background. Accordingly, GBP may continue to rise this week. Meetings of the Federal Reserve and the Bank of England are coming up, and we expect a new slowdown in the rate hikes from the US central bank. This factor may well push the pair up.
What we see on the trading charts:
Price levels of support and resistance are thick red lines, near which the movement may end. They do not provide trading signals.
The Kijun-sen and Senkou Span B lines are the lines of the Ichimoku indicator, moved to the one-hour chart from the 4-hour one. They are strong lines.
Extreme levels are thin red lines from which the price bounced earlier. They provide trading signals.
Yellow lines are trend lines, trend channels, and any other technical patterns.
Indicator 1 on the COT charts reflects the net position size of each category of traders.
Indicator 2 on the COT charts reflects the net position size for the non-commercial group.