Analyzing Tuesday's trades:
EUR/USD on 1H chart
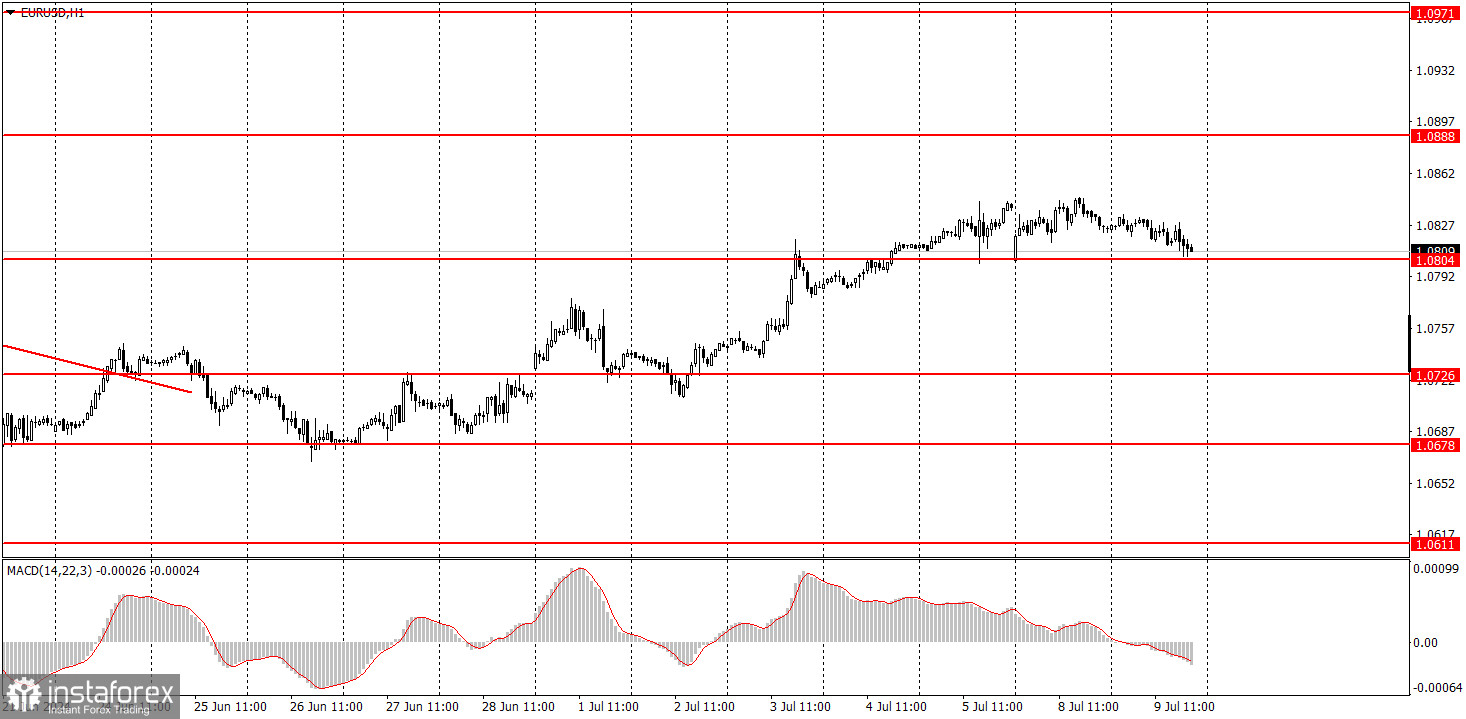
EUR/USD continued its sluggish downward corrective movement on Tuesday. Let's clarify the situation to avoid any questions later – volatility was 28 pips. Honestly, it's hard to say if there's any point in conducting any analysis. Only one important event was scheduled for the day – Federal Reserve Chairman Jerome Powell's testimony before the US Congress. Powell was due to deliver a speech and answer questions from the Senate Banking Committee. Now, let's look at the chart above – is there any reason to believe that Powell said anything important?
The Fed chair reiterated that officials don't expect to cut interest rates, showing increasing faith that inflation will return to the Fed's target, but he also says that they need more good data. Therefore, the Fed will continue to closely monitor macroeconomic data and will start easing monetary policy when the time comes. The market has heard this at least 100 times before, so it didn't even consider reacting for the sake of appearances. And as for volatility, there's nothing to say – it continues to fall, in fact it's already at the lowest levels.
EUR/USD on 5M chart
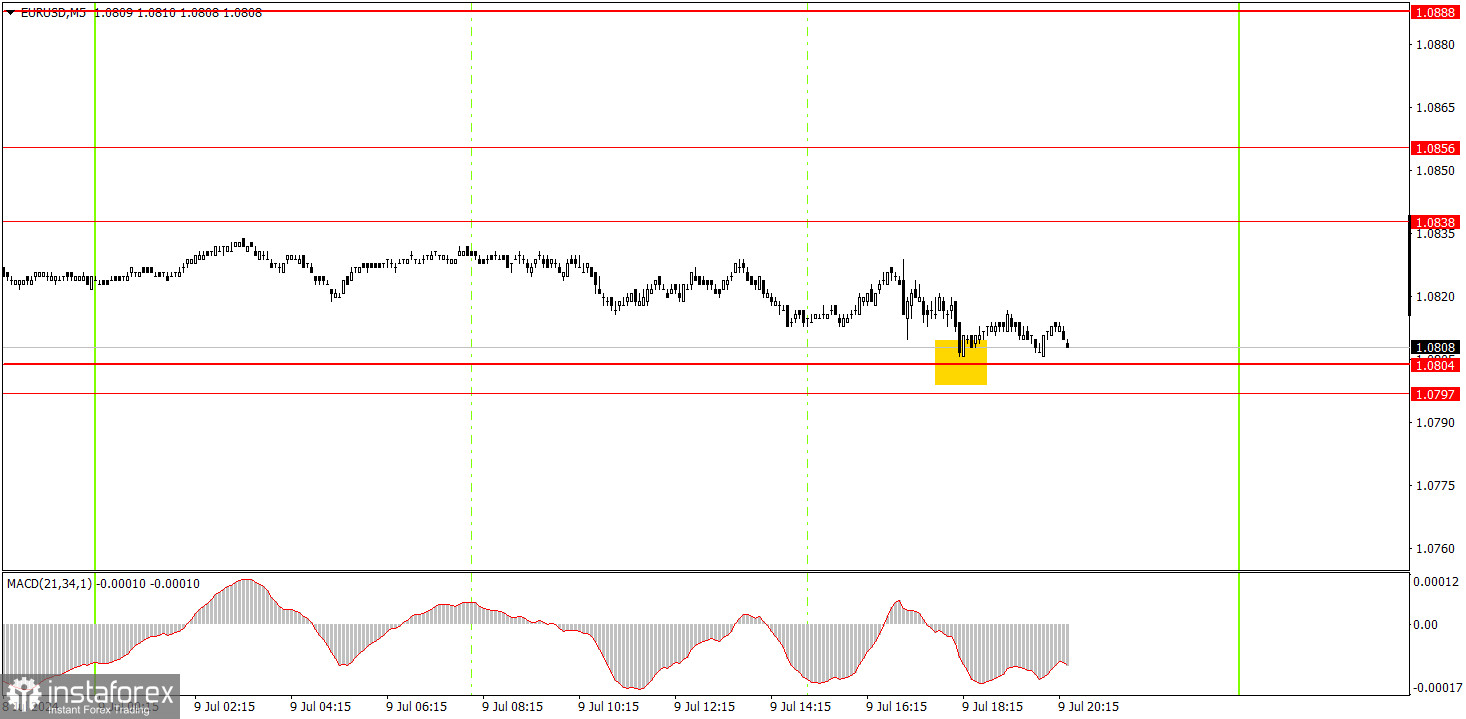
On the 5-minute time frame, the pair struggled to work out the 1.0797-1.0804 area by the end of the day. There was no bounce from this area, so there were no grounds for opening long positions. As a reminder, the price bounced from the 1.0838-1.0856 area thrice on Monday. It turns out that Monday's signals were worked out on Tuesday. And we're talking about a movement of about 30 pips. These are the current realities of the forex market. It takes two days to cover 30 pips.
Trading tips on Wednesday:
On the hourly chart, EUR/USD is unable to break through the 1.0678 level, and last week's economic reports had a devastating effect on the dollar. Therefore, it was logical for the euro to rise. Despite this movement, the overall (downward) trend has not changed, but the euro has been frequently trading with strong corrections over the past 7-8 months. Formally, the euro is in a downward trend, as seen on the higher time frames, but the process of the pair's decline in the medium-term has been extremely slow.
On Wednesday, beginners can trade from the 1.0797-1.0804 area. However, please note that the pair may experience very low volatility. Even Powell's speech did not evoke any emotions in the market.
The key levels on the 5M chart are 1.0483, 1.0526, 1.0568, 1.0611, 1.0678, 1.0726-1.0733, 1.0797-1.0804, 1.0838-1.0856, 1.0888-1.0896, 1.0940, 1.0971-1.0981. For Wednesday, neither the Eurozone nor the US have any significant events scheduled, except for another speech by Powell. But as we saw yesterday, traders could easily ignore this event.
Basic trading rules:
1) Signal strength is determined by the time taken for its formation (either a bounce or level breach). A shorter formation time indicates a stronger signal.
2) If two or more trades around a certain level are initiated based on false signals, subsequent signals from that level should be disregarded.
3) In a flat market, any currency pair can produce multiple false signals or none at all. In any case, the flat trend is not the best condition for trading.
4) Trading activities are confined between the onset of the European session and mid-way through the U.S. session, after which all open trades should be manually closed.
5) On the 30-minute timeframe, trades based on MACD signals are only advisable amidst substantial volatility and an established trend, confirmed either by a trendline or trend channel.
6) If two levels lie closely together (ranging from 5 to 15 pips apart), they should be considered as a support or resistance zone.
How to read charts:
Support and Resistance price levels can serve as targets when buying or selling. You can place Take Profit levels near them.
Red lines represent channels or trend lines, depicting the current market trend and indicating the preferable trading direction.
The MACD(14,22,3) indicator, encompassing both the histogram and signal line, acts as an auxiliary tool and can also be used as a signal source.
Significant speeches and reports (always noted in the news calendar) can profoundly influence the price dynamics. Hence, trading during their release calls for heightened caution. It may be reasonable to exit the market to prevent abrupt price reversals against the prevailing trend.
Beginners should always remember that not every trade will yield profit. Establishing a clear strategy coupled with sound money management is the cornerstone of sustained trading success.