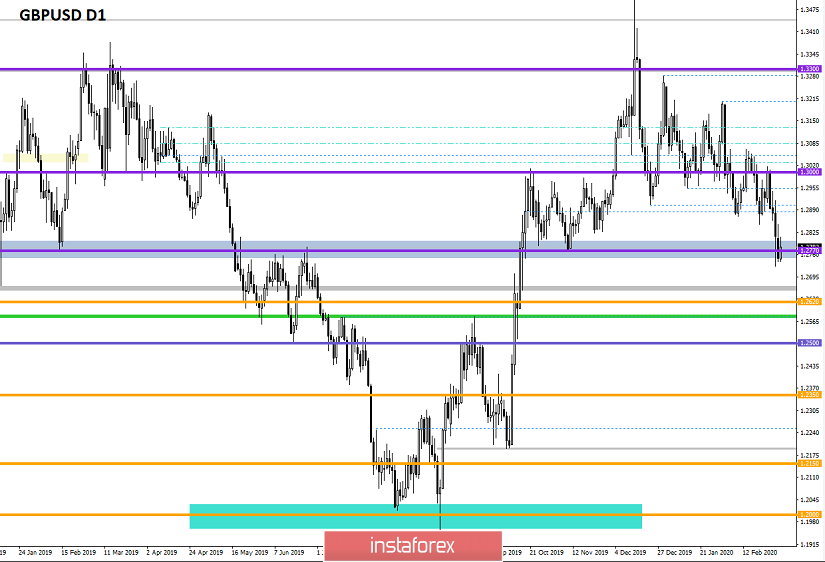
From the point of view of complex analysis, we see a characteristic hang at the level of 1.2770, and now let's talk about the details. The start of the new week was dedicated to the return of the price to the area of the pivot point 1.2770, where the previously formed pullback was generated 100%. In fact, we see the characteristic wariness of market participants, where they are ready for a further downward movement, but the first step is not easy to take. Let me remind you that the level of 1.2770, which is the structure of the range [1.2770 // 1.2885 // 1.3000], came to us last year, where work with it was carried out both in autumn and spring, and in any case, it was a strong coordinates. If we consider the current situation, then we have a given downward rate in contrast to the decline of 2019, which can simplify the task in its breakdown. Naturally, any measure has a reflection, expressed in correction / rollback / stagnation, and if we look at the last four candles of the daily chart, we will see that these phases were absent, and there is a risk of their occurrence. Now, we understand the reason for the caution of possible danger, in terms of technical analysis.
Regarding the theory of downward development, everything goes on as usual, where the quote reached the lower limit of the range 1.2770 // 1.2885 // 1.3000, the first phase of development came to an end. Now,it is necessary to overcome this parameter and maintain the specified descending clock rate. In this case, we will move on to the next stage - recovery relative to the medium-term upward trend 03.09.19-13.12.19. At this stage, we are waiting for a sequential decline towards the base on 09/03/19, where many steps 1.2620 await us to the triumphal point; 1.2500; 1.2350; 1.2150. I remind you that the theory of downward development refers to the medium term, do not expect instant changes.
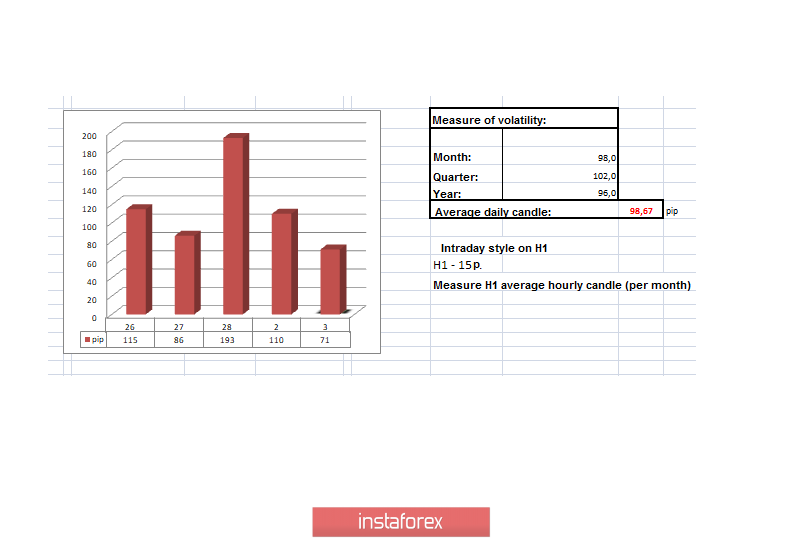
In terms of volatility, we see that even with a hang at the level of 1.2770, market activity is high, where the acceleration is systematically focused above the daily average.
Details of volatility: Tuesday - 103 points; Wednesday - 115 points; Thursday - 86 points; Friday - 193 points; Monday - 110 points. The average daily indicator relative to the dynamics of volatility is 98 points [see table of volatility at the end of the article].
Detailing minute by minute, we see that the first round of the downward movement came at the start of the European session and lasted up to the level of 1.2770. After that, there was a stagnation of several hours with an amplitude of about 50 points and a local surge back. During the evening, the quote returned to the area of 1.2770, fixing below it.
As discussed in the previous review, intraday traders mostly sit outside the market due to the characteristic alertness, as described above. In turn, the coordinate 1.2750, to which the landmark was indicated, could not combine all the criteria. Therefore, if the deals were opened, then not with the full amount. Moreover, medium-term traders invariably adhere to the theory of downward development, where rollback / correction is not a hindrance to them, and further adding to existing trading volumes will occur after the breakdown of the existing situation with the level of 1.2770.
Considering the trading chart in general terms [the daily period], we see that the quote is already very close to moving to a new level, where the development of the medium-term upward movement fluctuates at the level of 50%.
The news background of the past day contained the final data on the index of business activity in the UK manufacturing sector, where the growth was from 50.0 to 51.7 with a forecast of 51.9. Based on the IHS Markit report, we see that there are indirect references to coronavirus, and due to which, there were delays in the supply of materials, an increase in input costs and increased pressure on procurement stocks. Regarding the British lending market, we see that the volume of mortgage lending declined from 4.40 billion pounds to 4.01 billion pounds, with a forecast of growth of 4.8 billion pounds.
The reaction of the market to statistics was laid in the general background of the weakening pound.
In terms of general informational background, we have the first day of negotiations on a future trade agreement after Brexit, which were not held in such bad tones as expected. The structure of the first stage includes topics, in particular, trade, energy, and fisheries.
"On Monday, a series of meetings took place between the delegations, specific discussions on the topics of the negotiation process will begin on Tuesday," a source from the European Commission said.
In turn, the main negotiator from the European Union Michel Barnier noted that the start of the negotiations was constructive, the parties aimed at an ambitious and honest partnership.
"The negotiations began today [03/02/19] in Brussels. We approach them in a constructive spirit, we want to enter into an ambitious and honest partnership, and we will comply with our previous joint obligations. The first round will end on Thursday, and then will make a comprehensive statement to the press." Michelle Barnier tweeted on his account.
Today, in terms of the economic calendar, we have an index of business activity in the UK construction sector, where they expect minor growth. The main event will be the second day of negotiations in Brussels, where it is worth following comments and statements, if any.
Further development
Analyzing the current trading chart, we see quotes returning to the region of the variable resistance point of the past day. In fact, there are no changes, although a pull back to 1.2850 could have taken place against the background of that same wariness. In any case, our main task is to identify a clear resumption of the downward movement, where the level of 1.2770 with the following boundaries will fall, and the quote will move to a new level.
From the point of view of the emotional mood, we see that the majority of market participants are cautious in actions, which cannot be said about speculators who are oriented on volatility.
Detailing the available time interval, we see that the beginning of the day was in a bullish mood, but the structure of the candles is quite calm, which indicates a simple recovery. At the same time, the current candles are expressed in impulse and directed down.
In turn, intraday traders are waiting for the most suitable moment to enter short positions, where you need not just price fixing below the main level of 1.27700, but a kind of impulse, possibly against the background of negotiations or whole inertia. Meanwhile, medium-term traders are already in short positions, but they are also waiting for the new stage to come, as new profit will come with it, as well as topping up in the position.
Having a general picture of actions, it is possible to assume that the top-down strategy remains a priority, where for a start we will move the benchmark from 1.2750 to 1.2725 (minimum February 28). Subsequent actions depend on the background, as well as on the desire of sellers to go below, referring to inertia.
Based on the above information, we derive trading recommendations:
- Local buy positions are considered in case of price fixing higher than 1.2825 with the prospect of a move to 1.2850
- Sell positions are considered in case of fixing the price lower than 1.2725. It can be noted that you need the appropriate background, as well as inertia to stay in this direction; otherwise, a stagnation may occur, as it was before.
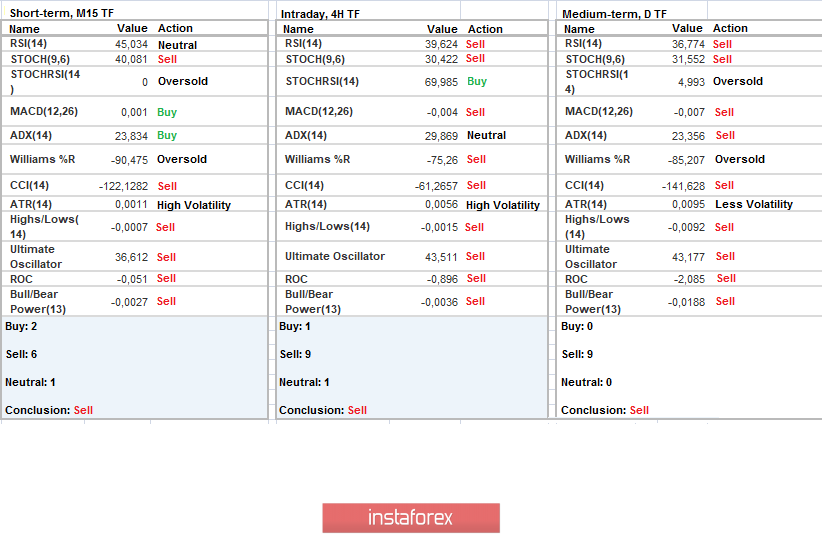
Indicator analysis
Analyzing a different sector of timeframes (TF), we see that the indicators of technical instruments signal a sale due to the strong pressure of gentle positions. It is worth considering that indicators on the minute and hour intervals can be unstable while we are in the stage of chatter at the level of 1.2770.
Volatility per week / Measurement of volatility: Month; Quarter; Year
Measurement of volatility reflects the average daily fluctuation, calculated for the Month / Quarter / Year.
(March 3 was built taking into account the time of publication of the article)
The current time volatility is 71 points, which is a high indicator for this time section. It is likely to assume that the characteristic acceleration will still persist in the market, and the negotiations in Brussels will become assistants to retain activity.
Key levels
Resistance Zones: 1.2885 *; 1.3000; 1.3170 **; 1.3300 **; 1.3600; 1.3850; 1.4000 ***; 1.4350 **.
Support areas: 1.2770 **; 1.2700 *; 1.2620; 1.2580 *; 1.2500 **; 1.2350 **; 1.2205 (+/- 10p.) *; 1.2150 **; 1,2000 ***; 1.1700; 1.1475 **.
* Periodic level
** Range Level
*** Psychological level
**** The article is built on the principle of conducting a transaction, with daily adjustment