empty
21.07.2022 08:28 PM
Technical analysis of AUD/USD for July 21, 2022

This image is no longer relevant

Overview :

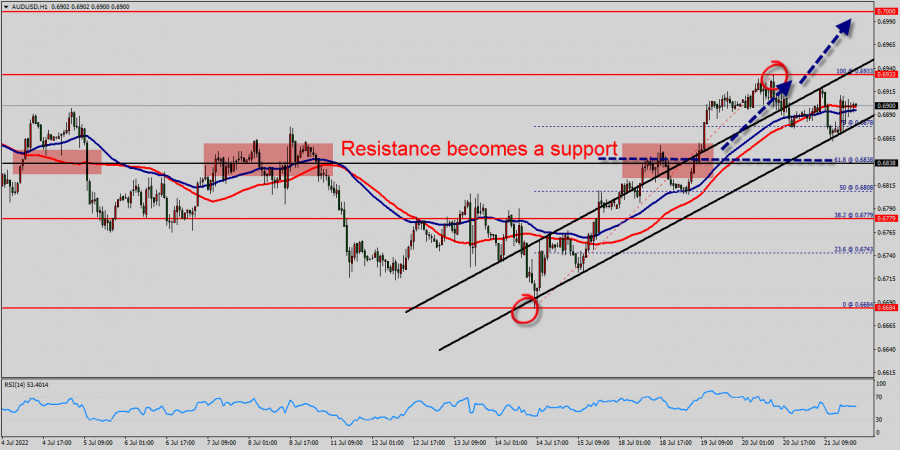
The AUD/USD (Australian Dollar/US Dollar or Aussie) pair has plunged up for a fresh two weeks high. Prices pushed above a key retracement from a Fibonacci setup that spans from the lowest price of 0.6838 (61.8% of Fibonacci on the hourly chart), for that buyers pulled the bid back-above that level by the end of the week.

Yesterday the AUD/USD pair traded up and closed the day in the red area near the price of 0.6838. Today it rose a little, rising above 0.6890.

On the hourly chart, the AUD/USD pair continues to test the strength of the resistance - the moving average line MA (100) H1 (0.6878).

On the four-hour chart, the AUD/USD pair is also still above the MA 500 H4 line. Based on the above, it is probably worth sticking to the north direction in trading, and as long as the the AUD/USD pair remains below MA 50 H4, it may be necessary to look for entry points to buy at the end of the correction.

The AUD/USD pair faced resistance at the level of 0.7000, while minor resistance is seen at 0.6933. Support is found at the levels of 0.6838 and 0.6769.

Also, it should be noted that a daily pivot point has already set at the level of 0.6838. Equally important, the AUD/USD pair is still moving around the key level at 0.6838, which represents a daily pivot in the H1 time frame at the moment.

That elongated wick on the underside of last week's candle has led to a continued bullish run so far this week, and prices have broken out of a rising wedge formation, which keeps the gate open for bullish continuation strategies.

Yesterday, the AUD/USD pair continued to move upwards from the level of 0.6838. The pair rose from the level of 0.6838 (this level of 0.6838 coincides with the key level of the golden ration 61.8%) to the top around 0.6933.

In consequence, the AUD/USD pair broke resistance, which turned strong support at the level of 0.6838. The level of 0.6838 is expected to act as major support today.

From this point, we expect the AUD/USD pair to continue moving in the bullish trend from the support level of 0.6838 towards the target level of 0.6933.

If the pair succeeds in passing through the level of 0.6933, the market will indicate the bullish opportunity above the level of 0.6933 in order to reach the second target at 0.7000.

On the other hand, in the very short term the general bullish sentiment is confirmed by technical indicators. Therefore, a small upwards rebound in the very short term could occur in case of excessive bearish movements.

Mourad El Keddani,
Especialista em análise na InstaForex
© 2007-2025
Selecionar intervalo de tempo
5
min
15
min
30
min
1
hora
4
horas
1
dia
1
s.
Ganhe com as variações das taxas das criptomoedas com a InstaForex.
Baixe o MetaTrader 4 e abra a sua primeira operação.
  • Grand Choice
    Contest by
    InstaForex
    InstaForex always strives to help you
    fulfill your biggest dreams.
    PARTICIPE DO CONCURSO

Recommended Stories

Sinais de negociação para EUR/USD para 28-30 de abril de 2025: venda abaixo de 1,1370 (SMA 21 - 7/8 de Murray)

Por outro lado, se a pressão de baixa prevalecer e o euro se consolidar abaixo de 1,1370, isso pode ser interpretado como um sinal de venda, com alvos no nível

Dimitrios Zappas 16:47 2025-04-28 UTC+2

Sinais de negociação para o OURO (XAU/USD) para 28-30 de abril de 2025: comprar acima de $3.270 ( SMA 21 - 7/8 de Murray)

O indicador Eagle está mostrando sinais de sobrevenda, portanto, acreditamos que o ouro poderia retomar seu ciclo de alta no curto prazo após uma correção técnica e atingir o nível

Dimitrios Zappas 16:43 2025-04-28 UTC+2

USD/JPY –Resumo e perspectivas

Na semana passada, o mercado renovou a mínima, mas os vendedores não conseguiram dar continuidade plena ao movimento de queda. Isso pode ter ocorrido porque a mínima da semana anterior

Evangelos Poulakis 16:20 2025-04-28 UTC+2

OURO – Visão geral da análise técnica

Na semana passada, os touros renovaram as máximas históricas, formando um novo pico em 3.499,58. Em seguida, o ouro iniciou uma correção de baixa, aproximando-se do suporte da tendência diária

Evangelos Poulakis 14:36 2025-04-28 UTC+2

Sinais de negociação para o EUR/USD para 24-26 de abril de 2025: venda abaixo de 1,1435 (SMA 214 - 7/8 de Murray)

Nosso plano de negociação para as próximas horas é aguardar que o euro se recupere até os níveis de resistência próximos de 1,1429 ou 1,1435 para vender, com alvos

Dimitrios Zappas 21:44 2025-04-24 UTC+2

Análise técnica do movimento de preço da prata, quinta-feira, 24 de abril de 2025

No gráfico de 4 horas, o instrumento da commodity prata apresenta sinais de fortalecimento. Esse cenário é confirmado pelo movimento do preço, que está acima da WMA (30, deslocamento 2)

Arief Makmur 17:28 2025-04-24 UTC+2

Análise técnica do movimento de preços do índice Nasdaq 100, quinta-feira, 24 de abril de 2025.

Embora o índice Nasdaq 100 esteja se movimentando lateralmente no gráfico de 4 horas, a faixa de oscilação é relativamente ampla, o que ainda representa uma oportunidade promissora. Atualmente

Arief Makmur 17:25 2025-04-24 UTC+2

OURO: Os preços do ouro podem cair significativamente em um futuro próximo

Os preços do ouro passaram recentemente por uma correção significativa, refletindo as expectativas de que Estados Unidos e China iniciem negociações concretas sobre tarifas e comércio em geral. A declaração

Pati Gani 17:16 2025-04-24 UTC+2

Análise técnica do movimento intradiário de preços do AUD/JPY, quarta-feira, 23 de abril de 2025

Com a presença de uma divergência entre o movimento de preços do par AUD/JPY e o indicador Stochastic Oscillator, além do preço estar acima da média móvel ponderada (WMA)

Arief Makmur 16:00 2025-04-23 UTC+2
Não pode falar agora?
Faça sua pergunta no chat.
Widget callback
 

Dear visitor,

Your IP address shows that you are currently located in the USA. If you are a resident of the United States, you are prohibited from using the services of InstaFintech Group including online trading, online transfers, deposit/withdrawal of funds, etc.

If you think you are seeing this message by mistake and your location is not the US, kindly proceed to the website. Otherwise, you must leave the website in order to comply with government restrictions.

Why does your IP address show your location as the USA?

  • - you are using a VPN provided by a hosting company based in the United States;
  • - your IP does not have proper WHOIS records;
  • - an error occurred in the WHOIS geolocation database.

Please confirm whether you are a US resident or not by clicking the relevant button below. If you choose the wrong option, being a US resident, you will not be able to open an account with InstaForex anyway.

We are sorry for any inconvenience caused by this message.