What is needed to open long positions on GBP/USD
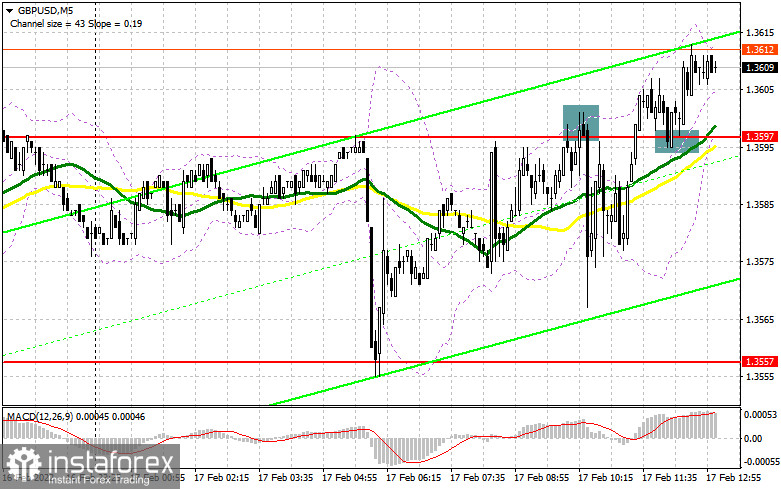
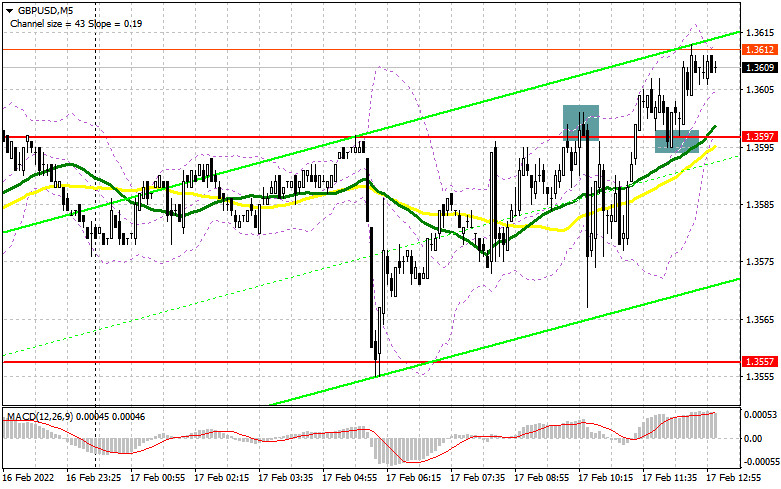
In my morning article, I turned your attention to 1.3597 and recommended taking decisions on the market entry with this level in focus. Now let's take a look at the 5-minute chart and try to figure out what has actually happened. GBP recovered in the first half of the day following a decline to 1.3597 in the Asian trade. Later on, there was a false breakout. So, we had a nice entry point for short positions. Nevertheless, the currency pair did not make a notable decline. GBP fell 20-25 pips, rebounded, and made the second test of 1.3597. This price action enabled the instrument to climb higher and consolidate there. Then, the price had a test downwards that created a good entry point with long positions this time. By the time of writing this article, GBP/USD had risen nearly 20 pips, heading for new resistance at 1.3621. As you understand, the technical picture changed in the second half of the day.
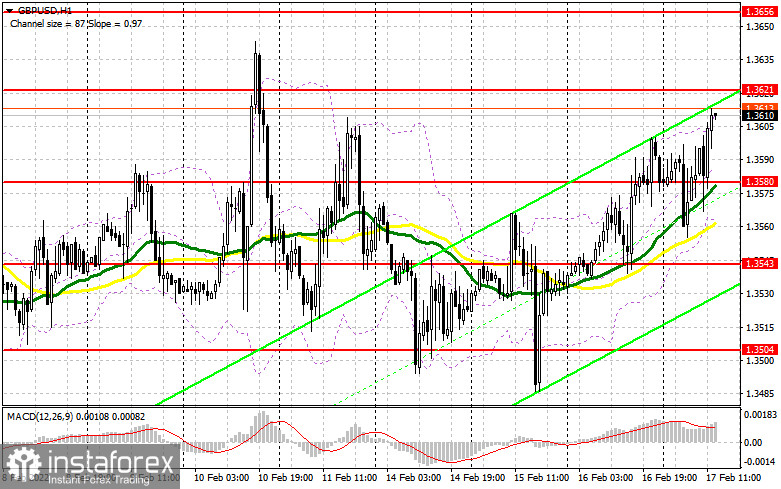
The economic calendar contains serious fundamental data that is due in the American session. The data could influence GBP/USD, discouraging GBP buyers. Yesterday, the bears made unsuccessful efforts to regain control over the market after strong data from the US. Today the situation may repeat itself. US initial unemployment claims are expected to contract sharply last week. If GBP avoids selling pressure, it would be better to stick to the trading plan for going long on GBP/USD. While the currency pair is trading above 1.3580, there is a high chance of further growth. The major task for the bulls in the second half of the day is to defend support at 1.3580 to ensure a further uptrend. Besides, the bulls have to break new resistance of 1.3561 which is to be tested soon.
The reasonable trading plan would be long positions in case GBP/USD makes a downward correction in the second half of the day. The correction may be triggered by the Philadelphia Fed manufacturing index and a report on US building permits. However, traders will give priority to a speech by FOMC member James Bullard. A false breakout at 1.3580, where there are moving averages, will contribute to a good market entry point for going long. A breakout and test of 1.3621 which is the buyers' target today will create an extra signal for opening long positions with the target of 1.3656. 1.3694 is seen as a higher target where I recommend profit taking. Alternatively, GBP/USD could lower in the American session and the bulls could be sluggish at 1.3580. This may happen because traders might be worried by remarks from the Fed's policymakers. In this case, it would be better to exercise caution about buying risky assets. I would recommend waiting until the next major level of 1.3543 is tested. If there is a false breakout there, we would have a market entry point for going long. We will be able to buy GBP immediately at a drop off 1.3504, the last hope of the buyers, or lower from 1.3465, bearing in mind a 20-25 pips intraday correction.
What is needed to open short positions on GBP/USD
For the time being, the bears are reluctant to enter the market in light of their failed attempt to defend 1.3597. Now the prior task for the bears is to protect new resistance at 1.3621. If they allow GBP to climb higher, they will lose all their achievements of the last week. The price may form a false breakout at 1.3621 amid strong US data. This will create an excellent market entry point for going short. The bear market may resume if the currency pair falls to support at 1.3580 closing the European session. This is the level where moving averages are passing, playing in favor of the bulls. So, the bears will find it difficult to push the price below this level.
A breakout and test of 1.3580 upwards will give an extra market entry point to open short positions with downward target at 1.3543 and 1.3504. If the lower level is tested, the bulls will lose all their achievements this week. A deeper target is seen at 1.3465 where I recommend profit taking. In case GBP/USD grows in the American session and the sellers lack activity at 1.3621, it would be better to cancel selling until the price climbs again to a one-month high at 1.3656.
I would recommend opening short positions there on conditions of a false breakout. We could sell GBP/USD immediately at a bounce off 1.3694, bearing in mind a 20-25 pips intraday correction.
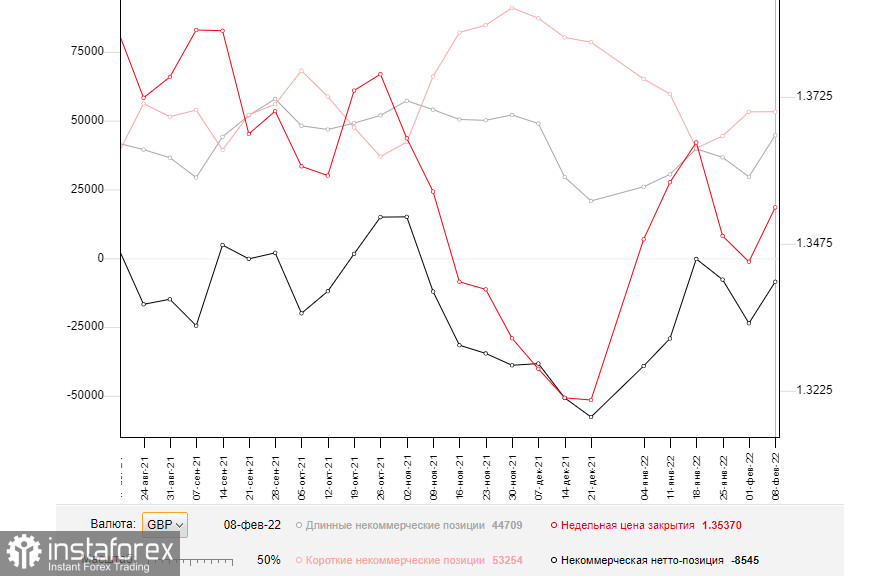
The COT (Commitment of Traders) report from February 8 logs a sharp increase both in short and long positions. Long positions prevail that contracted the negative delta's value. Nevertheless, the negative value remained last week. It means that the market is still in the grips of the sellers. Importantly, this COT report takes into account policy decisions of the Bank of England, including a rate hike. Despite this fact, GBP didn't find any help. Everybody is aware that the Bank of England ventured into monetary tightening in an effort to fight against soaring inflation. The British economic is going through rough times nowadays. The economic growth might stall anytime soon. That's why raising interest rates didn't fuel a rally in GBP. Geopolitical tensions between Russia and Ukraine and the Federal Reserve's hawkish rhetoric that implies the first rate hike in March dampen global risk sentiment. So, the bulls are cautious about buying GBP/USD. Some market participants expect the US central bank to raise the funds rate by 0.5% at a time, not by 0.25%. If so, such aggressive tightening will set the stage for a rapid advance of the US dollar.
According to the COT report from February 8, long non-commercial positions rose sharply from 29,597 to 44,709 whereas short non-commercial positions grew moderately from 53,202 to 53,254. This contracted abruptly the negative non-commercial net positions from -23,605 to -8,545. GBP/USD closed last week higher at 1.3537 from 1.3444.
Indicators' signals:
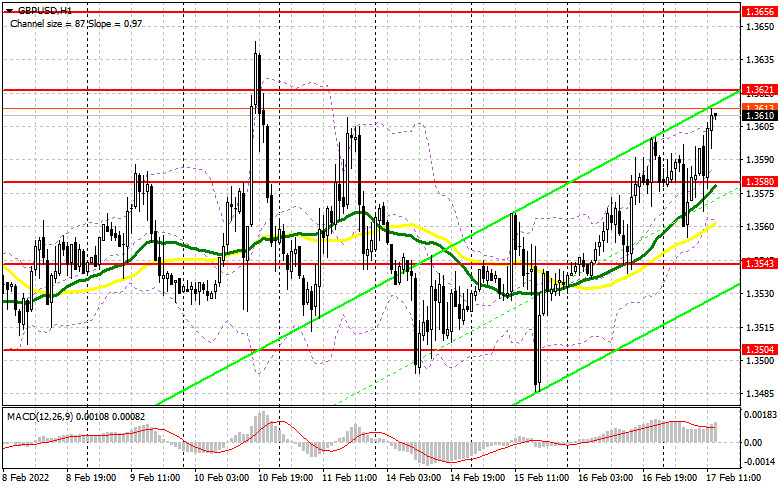
Trading is carried out above the 30 and 50 daily moving averages. It indicates that the bulls are determined to push GBP/USD higher.
Moving averages
Note: The period and prices of moving averages are considered by the author on the H1 hourly chart and differs from the general definition of the classic daily moving averages on the daily D1 chart.
Bollinger Bands
If GBP/USD declines, the indicator's lower border of 1.3565 will serve as support. Alternatively, if the currency pair grows, the upper border at 1.3605 will act as resistance.
Description of indicators
- Moving average (moving average, determines the current trend by smoothing out volatility and noise). Period 50. It is marked yellow on the chart.
- Moving average (moving average, determines the current trend by smoothing out volatility and noise). Period 30. It is marked green on the chart.
- MACD indicator (Moving Average Convergence/Divergence — convergence/divergence of moving averages) Quick EMA period 12. Slow EMA period to 26. SMA period 9
- Bollinger Bands (Bollinger Bands). Period 20
- Non-commercial speculative traders, such as individual traders, hedge funds, and large institutions that use the futures market for speculative purposes and meet certain requirements.
- Long non-commercial positions represent the total long open position of non-commercial traders.
- Short non-commercial positions represent the total short open position of non-commercial traders.
- Total non-commercial net position is the difference between short and long positions of non-commercial traders.