empty
04.11.2022 06:59 AM
Outlook and trading signals for EUR/USD on November 4. COT report. Analysis of market situation. Euro is losing chances for restoring the uptrend.

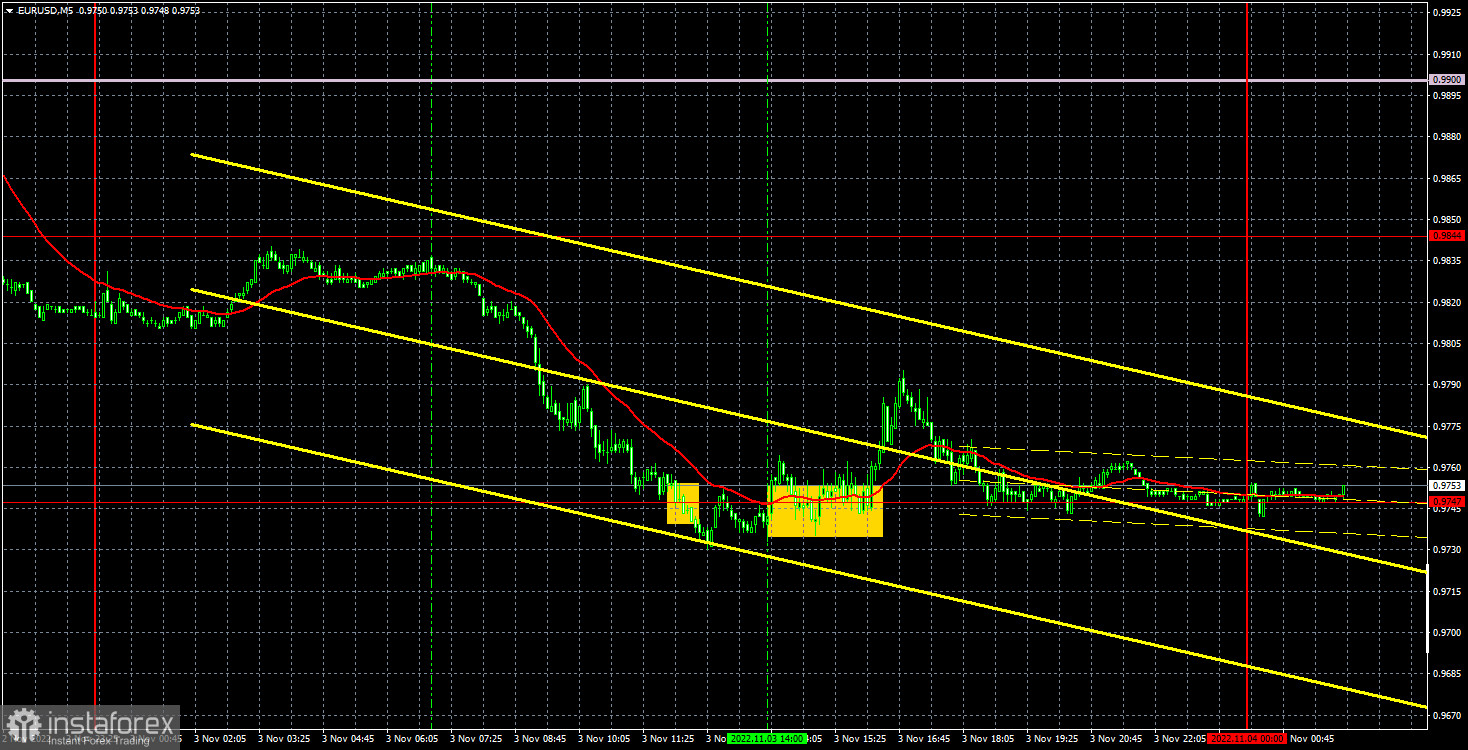
Analysis of EUR/USD, 5-minute chart

This image is no longer relevant

The euro/dollar pair moved down on Thursday. If in previous articles we called it "corrective", now it is already descending, as the price has overcome the ascending trend line. The price is now around 200 points away from its 20-year lows and, apparently, is going to fall back to them and maybe even surpass it. That's how quickly and rapidly the situation in the foreign exchange market is changing. A week ago, the euro had pretty good chances for growth, and now it is ready to continue a long-term downtrend, which has been going on for two years. We said earlier that the fundamental and macroeconomic backgrounds remain, in fact, unchanged for the euro/dollar pair. Those factors due to which the pair fell, at least in 2022, remain. The US central bank added fuel to the fire on Wednesday evening, which assured of its readiness to continue and further tighten monetary policy.

In regards to Thursday's trading signals, everything was unfortunate, since the first one was formed only when the price had already gone down 80 points. Therefore, the signal near the level of 0.9747 should not have been processed. We could have tried to work out the buy signal near the same level, formed during the US trading session, but it did not bring profit, as the price quickly returned to the level of 0.9747. The long position was closed by Stop Loss at breakeven.

COT report

This image is no longer relevant

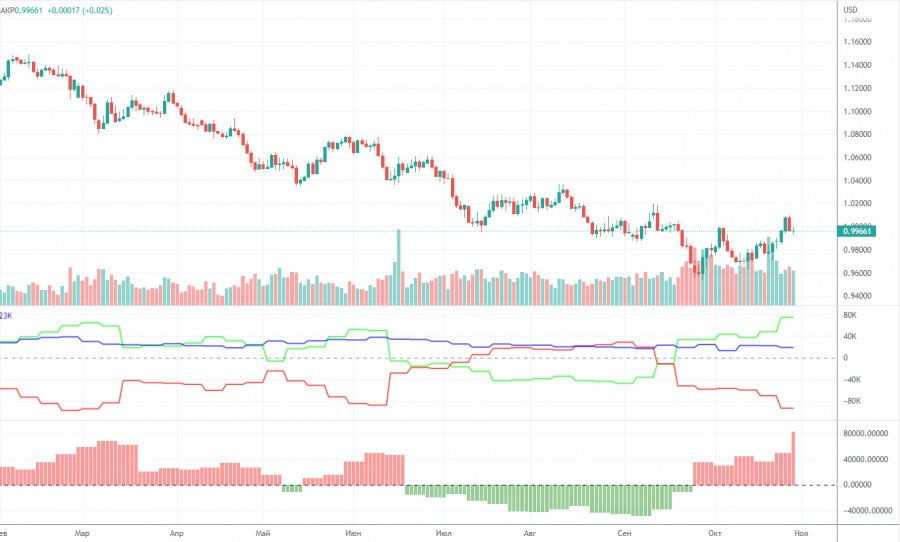
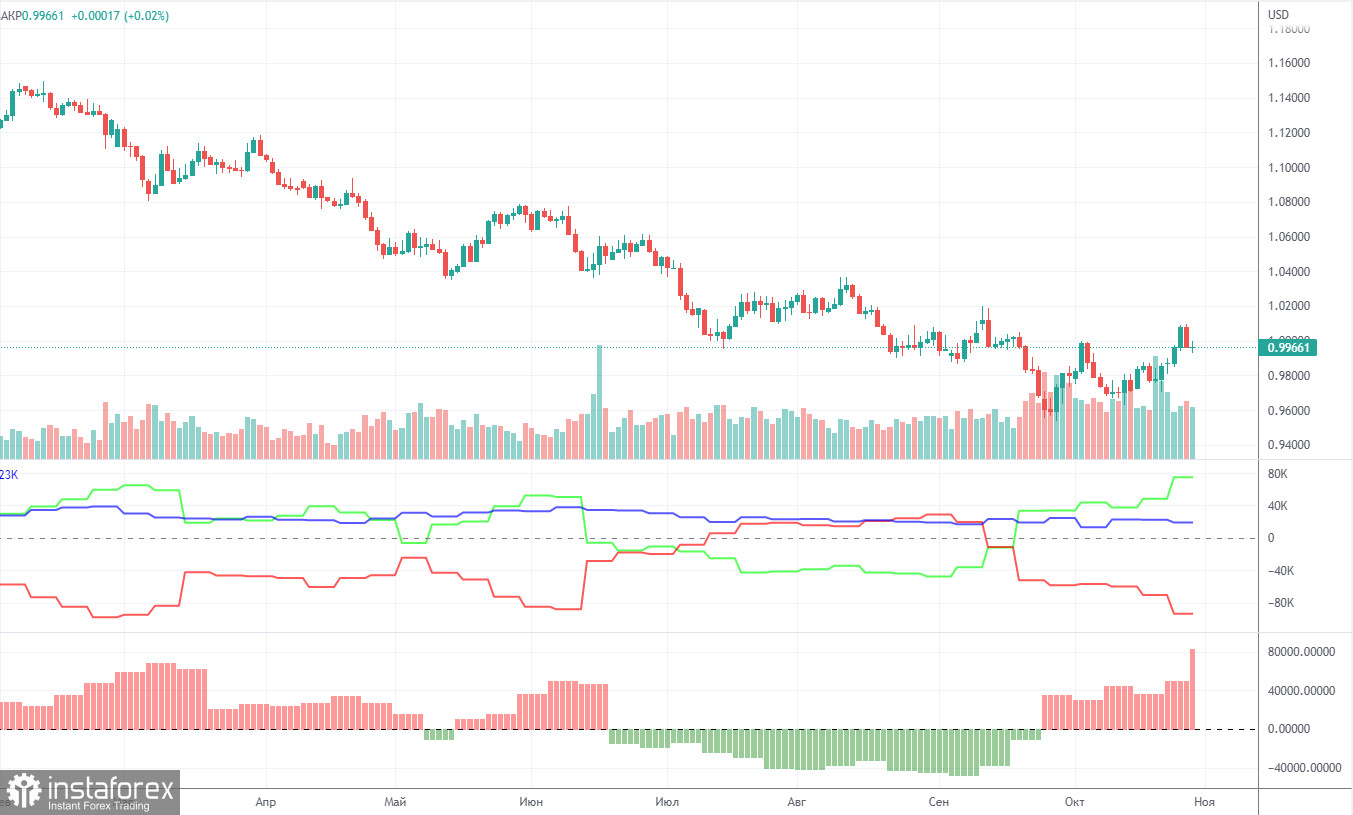
In 2022, the Commitment of Traders (COT) report for the euro is becoming more and more interesting. In the first part of the year, the reports were pointing to the bullish sentiment among professional traders. However, the euro was confidently losing value. Then, for several months, reports were reflecting bearish sentiment and the euro was also falling. Now, the net position of non-commercial traders is bullish again. The euro managed to rise above its 20-year low, adding 500 pips. This could be explained by the high demand for the US dollar amid the difficult geopolitical situation in the world. Even if demand for the euro is rising, high demand for the greenback prevents the euro from growing. In the given period, the number of short orders initiated by non-commercial traders increased by 24,000, whereas the number of long orders declined by 2,700. As a result, the net position increased by 26,700 contracts. However, this could hardly affect the situation since the euro is still at the bottom. At the moment, professional traders still prefer the greenback to the euro. The number of buy orders exceeds the number of sell orders by 75,000. However, the euro cannot benefit from the situation. Thus, the net position of non-commercial traders may go on rising without changing the market situation. Among all categories of traders, the number of long positions exceeds the number of short positions by 19,000 (609,000 against 590,000).

Analysis of EUR/USD, 1-hour chart

This image is no longer relevant

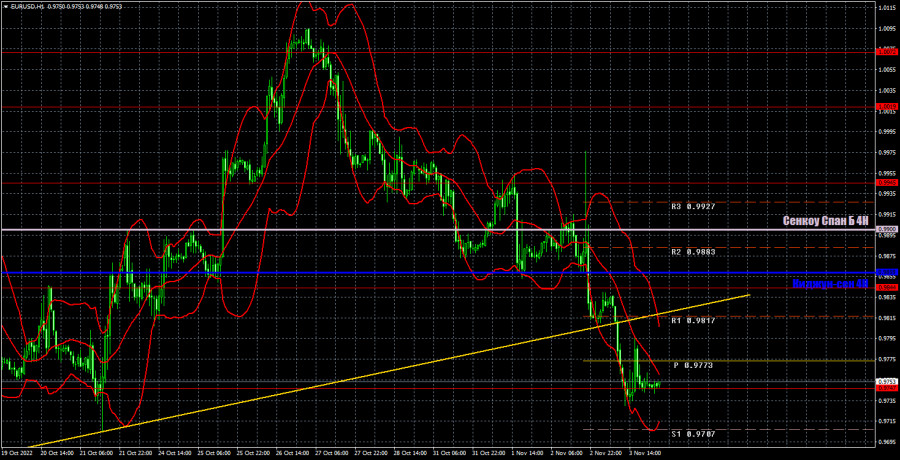
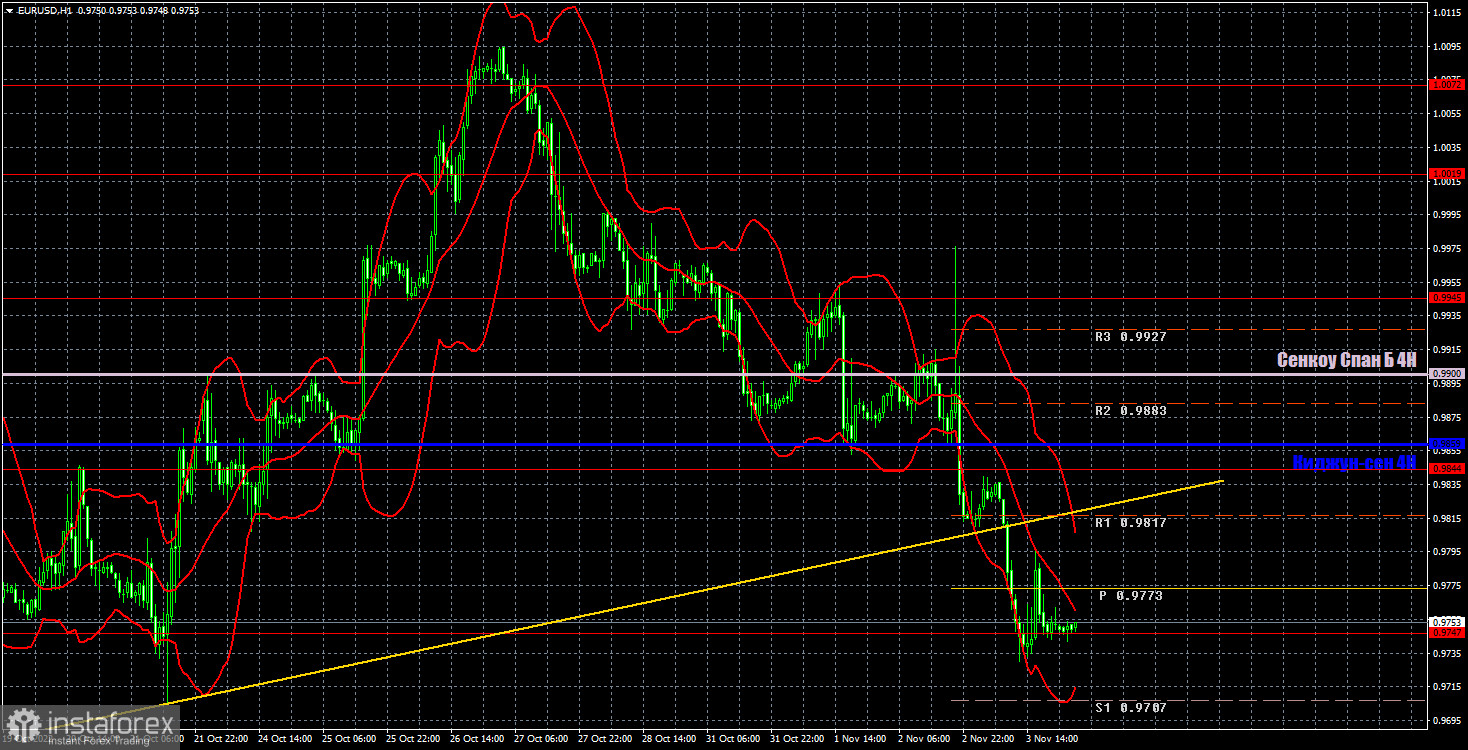
You can see that the pair has changed its trend to a downward one on the one-hour chart. After a six-day fall, an upward correction may follow. However, now the euro still needs to overcome the Senkou Span B and Kijun-sen lines, which are above them. The euro missed a good chance to form an upward trend, once again. On Friday, the pair may trade at the following levels: 0.9635, 0.9747, 0.9844, 0.9945, 1.0019, 1.0072, 1.0124, as well as the Senkou Span B (0.9900) and Kijun-sen lines (0.9859). Lines of the Ichimoku indicator may move during the day, which should be taken into account when determining trading signals. There are also support and resistance levels, but signals are not formed near these levels. Bounces and breakouts of the extreme levels and lines could act as signals. Don't forget about stop-loss orders, if the price covers 15 pips in the right direction. This will prevent you from losses in case of a false signal. The index of business activity in the services sector will be published in the European Union, as well as a speech by European Central Bank President Christine Lagarde. Reports on unemployment and nonfarm in the US. As you can see, there will be a lot of important statistics today, so the market could react to these reports.

What we see on the trading charts:

Price levels of support and resistance are thick red lines, near which the movement may end. They do not provide trading signals.

The Kijun-sen and Senkou Span B lines are the lines of the Ichimoku indicator, moved to the one-hour chart from the 4-hour one. They are strong lines.

Extreme levels are thin red lines from which the price bounced earlier. They provide trading signals.

Yellow lines are trend lines, trend channels, and any other technical patterns.

Indicator 1 on the COT charts reflects the net position size of each category of traders.

Indicator 2 on the COT charts reflects the net position size for the non-commercial group.

Paolo Greco,
Especialista em análise na InstaForex
© 2007-2025
Selecionar intervalo de tempo
5
min
15
min
30
min
1
hora
4
horas
1
dia
1
s.
Ganhe com as variações das taxas das criptomoedas com a InstaForex.
Baixe o MetaTrader 4 e abra a sua primeira operação.
  • Grand Choice
    Contest by
    InstaForex
    InstaForex always strives to help you
    fulfill your biggest dreams.
    PARTICIPE DO CONCURSO

Recommended Stories

GBP/USD: Plano de Negociação para a Sessão dos E.U.A de 26 de março (Revisão das Negociações da Manhã)

Na minha previsão desta manhã, destaquei o nível de 1,2926 como um ponto-chave para decisões de negociação. Agora, vamos analisar o gráfico de 5 minutos e ver o que aconteceu

Miroslaw Bawulski 19:14 2025-03-26 UTC+2

EUR/USD: Plano de Negociação para a Sessão dos E.U. de 26 de março (Revisão das Negociações da Manhã)

Na minha previsão matinal, destaquei o nível 1,0780 e planejei tomar decisões de entrada no mercado com base nele. Vamos dar uma olhada no gráfico de 5 minutos e analisar

Miroslaw Bawulski 18:57 2025-03-26 UTC+2

Recomendações de negociação e análise para o GBP/USD em 20 de março: Reunião do Banco da Inglaterra em breve

O par GBP/USD continuou sendo negociado dentro da mesma faixa na quarta-feira. Apesar da reunião do Fed, do discurso de Jerome Powell e da atualização do dot-plot, o mercado

Paolo Greco 16:47 2025-03-20 UTC+2

EUR/USD: Plano de Negociação para a Sessão dos E.U.A. de 14 de março (Revisão das Negociações da Manhã)

Na minha previsão da manhã, foquei no nível 1,0852 e planejei basear minhas decisões de negociação nele. Vamos examinar o gráfico de 5 minutos para ver o que aconteceu

Miroslaw Bawulski 21:10 2025-03-14 UTC+2

GBP/USD: Plano de Negociação para a Sessão dos E.U. de 11 de março (Análise das Negociações da Manhã). Compradores de Libra buscam uma nova máxima semanal

Na minha previsão da manhã, concentrei-me no nível 1,2876 e planejei tomar decisões de negociação com base nele. Vamos dar uma olhada no gráfico de 5 minutos e analisar

Miroslaw Bawulski 20:53 2025-03-11 UTC+2

EUR/USD: Plano de Negociação para a Sessão dos E.U. de 11 de março (Revisão das Negociações da Manhã). O euro continuou a subir e atualizou sua alta semanal

Na minha previsão da manhã, foquei no nível de 1,0886 e planejei tomar decisões de negociação com base nele. Vamos dar uma olhada no gráfico de 5 minutos e analisar

Miroslaw Bawulski 20:43 2025-03-11 UTC+2

Como negociar o GBP/USD em 7 de março? Dicas simples e análise de negociação para iniciantes

O par GBP/USD também se estabilizou na quinta-feira. Não houve razões fundamentais ou macroeconômicas que justificassem a alta ou queda da libra esterlina ou do dólar americano

Paolo Greco 16:17 2025-03-07 UTC+2

GBP/USD: Plano de Negociação para a Sessão dos E.U.A de 18 de fevereiro (Revisão das Negociações da Manhã)

Em minha previsão matinal, foquei no nível 1,2627 como um ponto-chave para as decisões de entrada no mercado. Olhando para o gráfico de 5 minutos, o par se moveu mais

Miroslaw Bawulski 16:52 2025-02-18 UTC+2

GBP/USD: Plano de negociação para a sessão dos E.U.A. de 14 de fevereiro (revisão da negociação da manhã)

Na minha previsão da manhã, foquei no nível 1,2568 e planejei tomar decisões de negociação com base nele. Vamos dar uma olhada no gráfico de 5 minutos e analisar

Miroslaw Bawulski 22:05 2025-02-14 UTC+2

GBP/USD: Plano de negociação para a sessão dos E.U.A. de 13 de fevereiro (análise das negociações da manhã)

Na minha previsão da manhã, me concentrei no nível 1,2505 e planejei tomar decisões de negociação com base nele. Vamos examinar o gráfico de 5 minutos para

Miroslaw Bawulski 21:41 2025-02-13 UTC+2
Não pode falar agora?
Faça sua pergunta no chat.
Widget callback
 

Dear visitor,

Your IP address shows that you are currently located in the USA. If you are a resident of the United States, you are prohibited from using the services of InstaFintech Group including online trading, online transfers, deposit/withdrawal of funds, etc.

If you think you are seeing this message by mistake and your location is not the US, kindly proceed to the website. Otherwise, you must leave the website in order to comply with government restrictions.

Why does your IP address show your location as the USA?

  • - you are using a VPN provided by a hosting company based in the United States;
  • - your IP does not have proper WHOIS records;
  • - an error occurred in the WHOIS geolocation database.

Please confirm whether you are a US resident or not by clicking the relevant button below. If you choose the wrong option, being a US resident, you will not be able to open an account with InstaForex anyway.

We are sorry for any inconvenience caused by this message.