M5 chart of GBP/USD
GBP/USD was quite active on Wednesday (volatility was at least 100 pips), but it spent the last few days between 1.2007 and 1.2106. Thus, it is safe to say that sterling ended up in the horizontal channel as well. Basically, this is not surprising, since today is December 29. The pound has already pleased us in the last days of the year with its relatively good trend movement. Now it has gone to a well-deserved rest. There was no macroeconomic and fundamental background on Wednesday and the situation will not change before the end of the week. I expect the pair to fall next month but now the flat may persist for some time.
Despite the fact that the pair was in the 100-point horizontal channel, trading signals continue to form quite well. And not all of them are false. The first buy signal was formed last night, but at the opening of the European trading session, the pair was not too far from the point of formation, so a long position could be opened. The price eventually crossed the critical line and the 1.2106 mark. It was necessary to close the long positions after the price settled below 1.2106. This will enable you to earn 60 pips. You should open a short position when the pair settles below 1.2106. The pair started falling almost rapidly and by the end of the day it was near 1.2007, but there were no other signals. Therefore, you should have manually closed the position, which has brought about 50 pips more. Thus, despite the flat, traders managed to make at least 100 pips according to our recommendations.
COT report
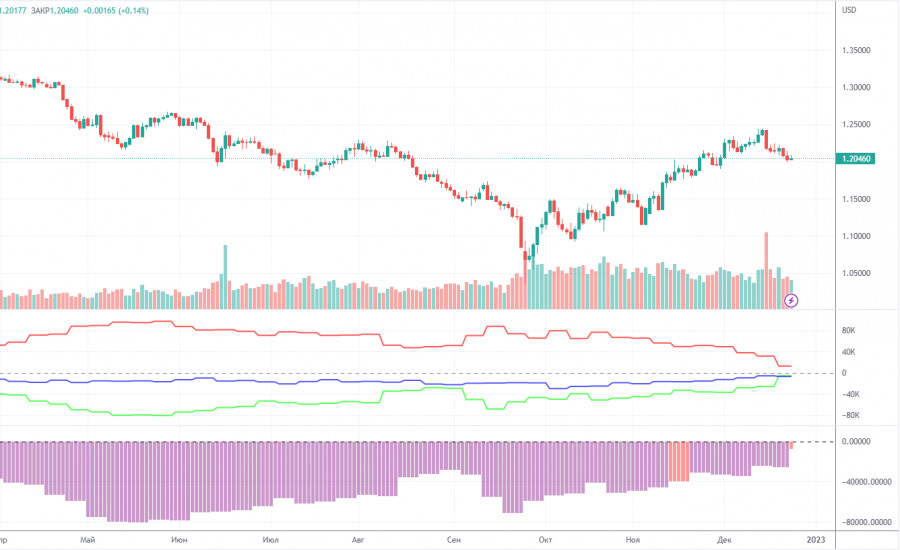
The latest COT report showed a decrease in bearish sentiment. During the given period, non-commercial traders opened 3,200 long positions and closed as many as 16,800 short positions. Thus, the net position grew by about 20,000, which is a lot for the pound. This figure has been on the rise for several months. Nevertheless, sentiment remains bearish, and GBP/USD is on the rise for no reason. I assume that the pair may well resume the downtrend soon since there is a need for at least a correction. Notably, both GBP/USD and EUR/USD now show practically identical movement. Since the net position is not even bullish yet, buying may continue for a few months to come. Non-commercial traders now hold 40,800,000 short positions and 35,200 long ones. The gap between them is small. I am still skeptical about the pound's long term growth, though there are technical reasons for it. At the same time, fundamental and geopolitical factors signal that the currency is unlikely to strengthen significantly.
H1 chart of GBP/USD
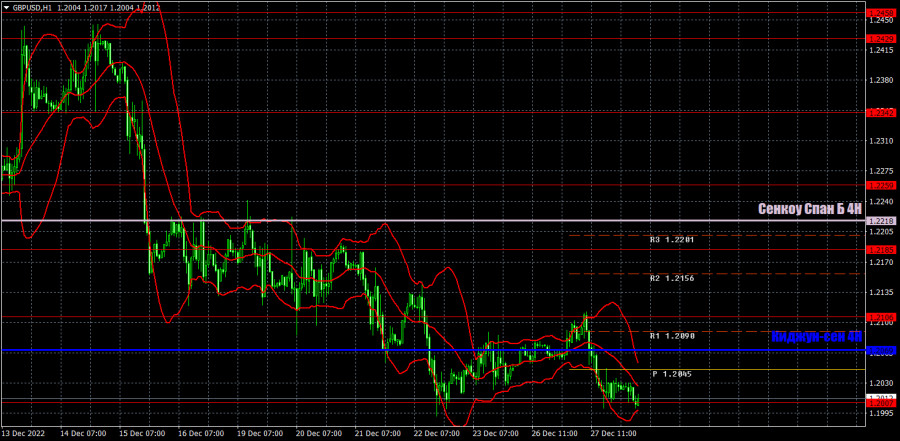
On the one-hour chart, GBP/USD maintains the bearish sentiment but also found itself in a horizontal channel. If this movement persists, the lines of the Ichimoku indicator may lose their strength in a short time, and we'll have to fix their last acceptable price value, because the pair can cross them 5 times a day in a flat. On Thursday, the pair may trade at the following levels: 1.1760, 1.1874, 1.1974-1.2007, 1.2106, 1.2185, 1.2259. Senkou Span B (1.2218) and Kijun Sen (1.2061) lines may also generate signals. Pullbacks and breakouts through these lines may produce signals as well. A Stop Loss order should be set at the breakeven point after the price passes 20 pips in the right direction. Ichimoku indicator lines may move during the day, which should be taken into account when determining trading signals. In addition, the chart does illustrate support and resistance levels, which could be used to lock in profits. There are no important events in the UK and the US, so there will be nothing to react to for today. I believe that the flat may last till the end of the year, or even longer.
What we see on the trading charts:
Price levels of support and resistance are thick red lines, near which the movement may end. They do not provide trading signals.
The Kijun-sen and Senkou Span B lines are the lines of the Ichimoku indicator, moved to the one-hour chart from the 4-hour one. They are strong lines.
Extreme levels are thin red lines from which the price bounced earlier. They provide trading signals.
Yellow lines are trend lines, trend channels, and any other technical patterns.
Indicator 1 on the COT charts reflects the net position size of each category of traders.
Indicator 2 on the COT charts reflects the net position size for the non-commercial group.


