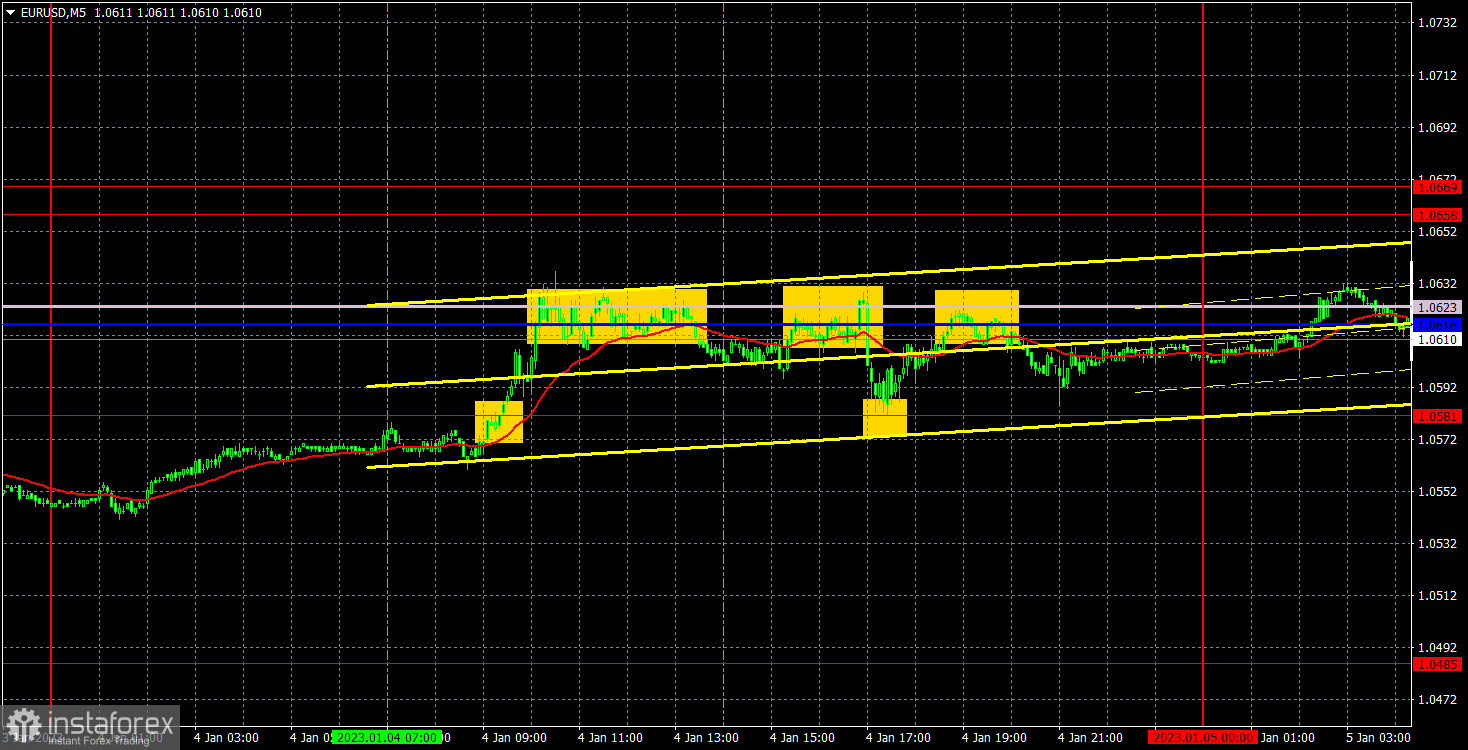
M5 chart of EUR/USD
EUR/USD quickly returned to the 1.0581-1.0658 horizontal channel on Thursday and it moved exclusively sideways for most of the day. I certainly don't think that the flat will resume now, though we cannot totally rule it out. Anyway, important macro data are coming out now, the holidays are coming to an end, representatives of central banks will soon come back to work and they will soon deliver their speeches. However, after the quotes closed below the horizontal channel on Tuesday the downward movement did not continue, which is important. On the one hand, it might mean a pullback to the upside, after which the fall will resume. On the other hand, there were no reasons for the euro to fall on Tuesday, so the market may just admit its mistake and continue moving in the flat. Tomorrow's EU and US macro data is against the second option, as it is hard to imagine that the inflation and non-farms reports will be ignored by the market.
All of Wednesday's trading signals were formed in the 1.0581-1.0623 area. That is, in the 40-point range, where the Senkou Span B and Kijun Sen lines ran. Therefore, each time a signal was formed, the price was almost immediately near the next important line or level. Theoretically, it was possible to "add" some ten points of profit, but we leave these decisions to traders, because not everybody likes to trade in the absolute flat. In any case, almost all of the trading signals were not false.
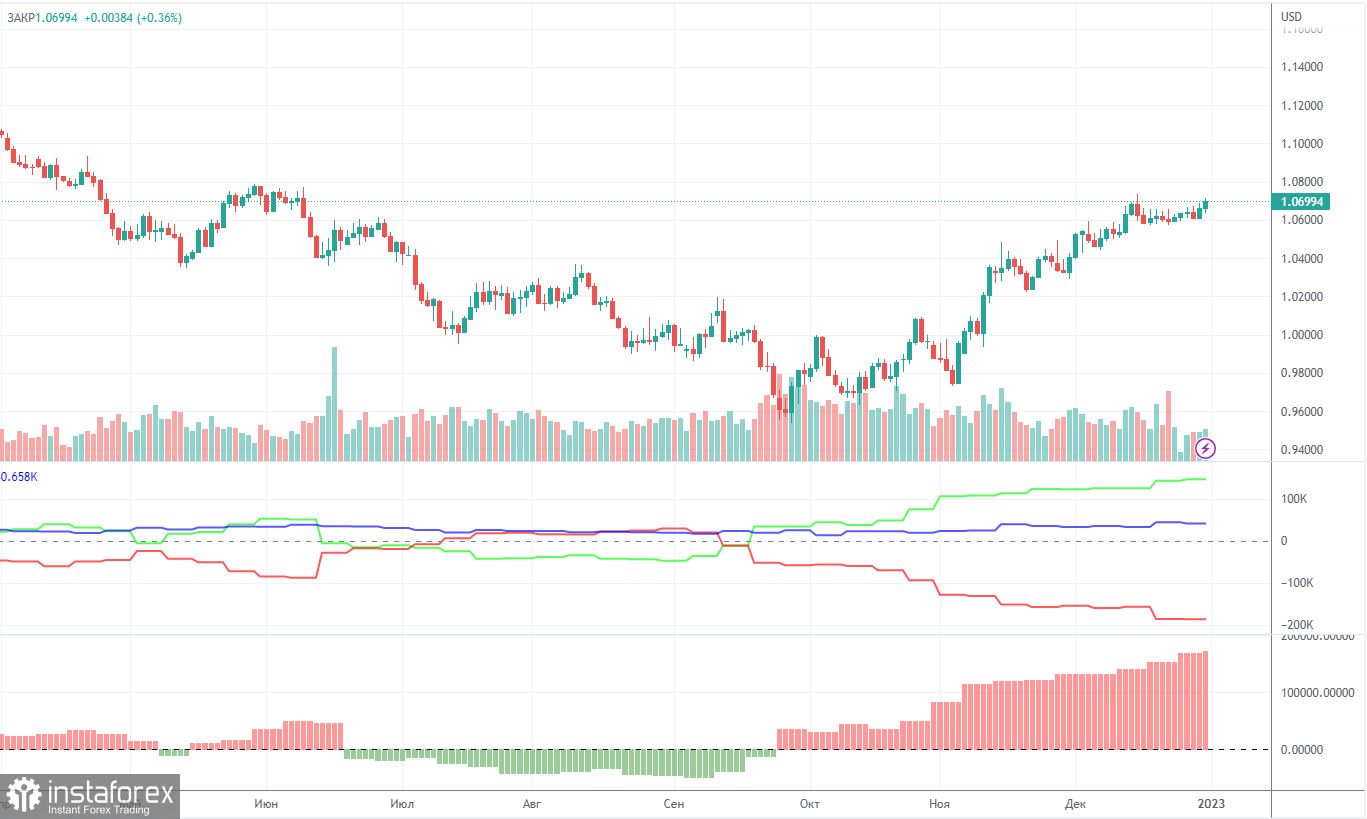
COT report
The COT reports for the euro in the last few months have been fully consistent with what is happening in the market. You can clearly see on the chart that the net position of big players (the second indicator) has been growing since early September. Around the same time, the euro started to grow. At this time, the net position of the non-commercial traders has been bullish and strengthens almost every week, but it is a rather high value that allows us to assume that the upward movement will end soon. Notably, the green and red lines of the first indicator have moved far apart from each other, which often means the end of the trend. During the given period, non-commercial traders opened 2,700 long positions, whereas the number of short positions fell by 1,100. Thus, the net positions rose by 3,800. The number of long positions is 146,000 higher than the number of short positions opened by non-commercial traders. So the question now is how long will the big players increase their longs? Moreover, from a technical perspective, a bearish correction should have started a long time ago. In my opinion, this process can not continue for another 2 or 3 months. Even the net position indicator shows that we need to "unload" a bit, that is, to correct. The overall number of short orders exceeds the number of long orders by 41,000 (685,000 vs. 644,000).
H1 chart of EUR/USD
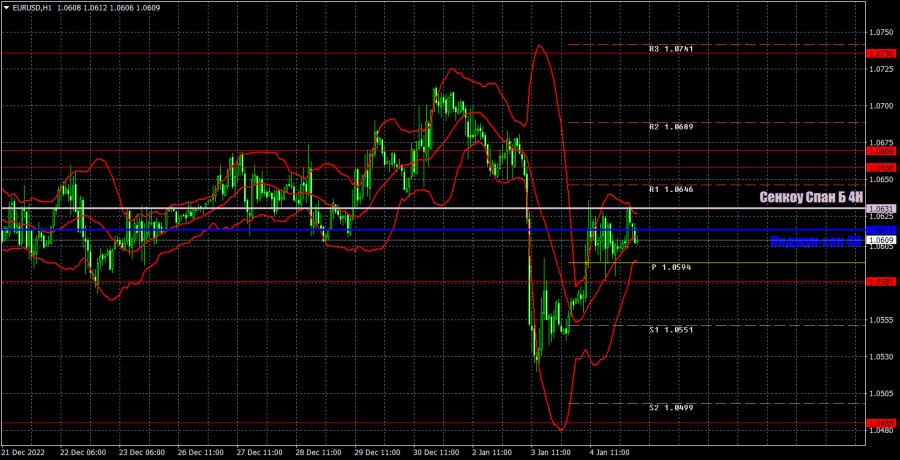
On the one-hour chart, EUR/USD clearly returned to the lines of the Ichimoku indicator, so now it is the moment of truth. If the price clearly bounces from these lines, the downward movement will resume. If not, the flat may resume. After Friday the pair could go anywhere because the macroeconomic background will be very strong on that day. On Thursday, the pair may trade at the following levels: 1.0269, 1.0340-1.0366, 1.0485, 1.0581, 1.0658-1.0669, and also Senkou Span B lines (1.0631) and Kijun Sen (1.0616). Lines of the Ichimoku indicator may move during the day, which should be taken into account when determining trading signals. There are also support and resistance levels, but signals are not formed near these levels. Bounces and breakouts of the extreme levels and lines could act as signals. Don't forget about stop-loss orders, if the price covers 15 pips in the right direction. This will prevent you from losses in case of a false signal. On January 5, the U.S. will release the ADP private sector report, unemployment claims and the second estimate of the service sector business activity index for December. All three reports are considered to be of little importance, so I don't expect the market to react to them.
What we see on the trading charts:
Price levels of support and resistance are thick red lines, near which the movement may end. They do not provide trading signals.
The Kijun-sen and Senkou Span B lines are the lines of the Ichimoku indicator, moved to the one-hour chart from the 4-hour one. They are strong lines.
Extreme levels are thin red lines from which the price bounced earlier. They provide trading signals.
Yellow lines are trend lines, trend channels, and any other technical patterns.
Indicator 1 on the COT charts reflects the net position size of each category of traders.
Indicator 2 on the COT charts reflects the net position size for the non-commercial group.