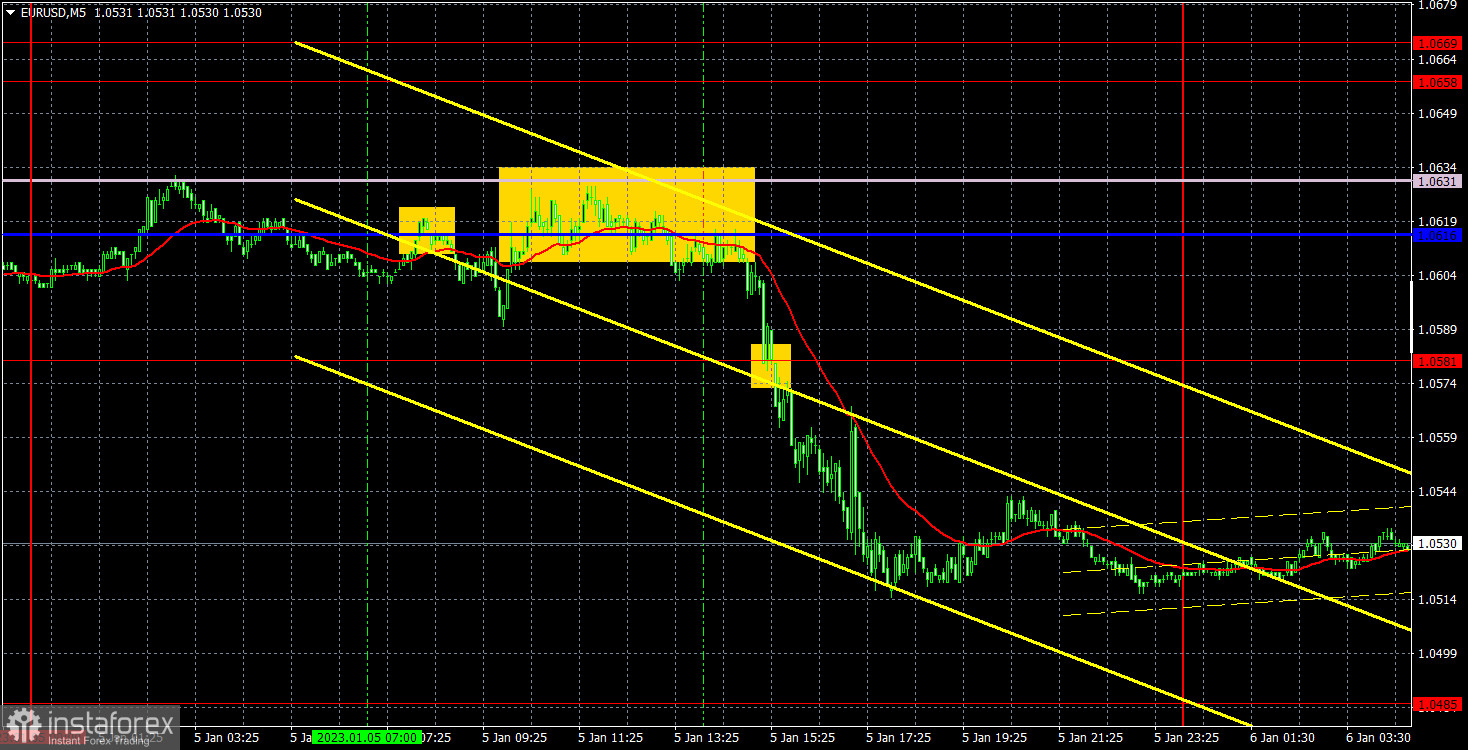
M5 chart of EUR/USD
On Thursday, EUR/USD resumed its downward movement and left the 1.0581-1.0658 horizontal channel for the second time in three days. We can't say that a single report or event caused the euro to fall and the dollar to rise, but overall, the whole macroeconomic and fundamental background is supporting the dollar right now. The Federal Reserve's minutes can be considered hawkish, while the ADP reports on unemployment claims and US services PMI were better than expected. Moreover, a technical bearish correction has been brewing for at least three weeks. That's why we think that EUR is falling right now. We just have to wait for today's results, which is the most important day of the week. The Nonfarm and unemployment reports may provoke a strong move, helped by the ISM Non-Manufacturing PMI, US payrolls and the European inflation data.
There were few trading signals on Thursday. During the European trading session, the price rebounded twice from 1.0616-1.0631. In the first case, it only passed 15 pips down, which was enough for the Stop Loss to be set to Breakeven, which was then used to close the short position. In the second case, a strong downward movement started, the pair crossed 1.0581, but it failed to fall to the next target level of 1.0485 until the end of the day. Thus, the position should have been closed manually in profit of about 70 pips.
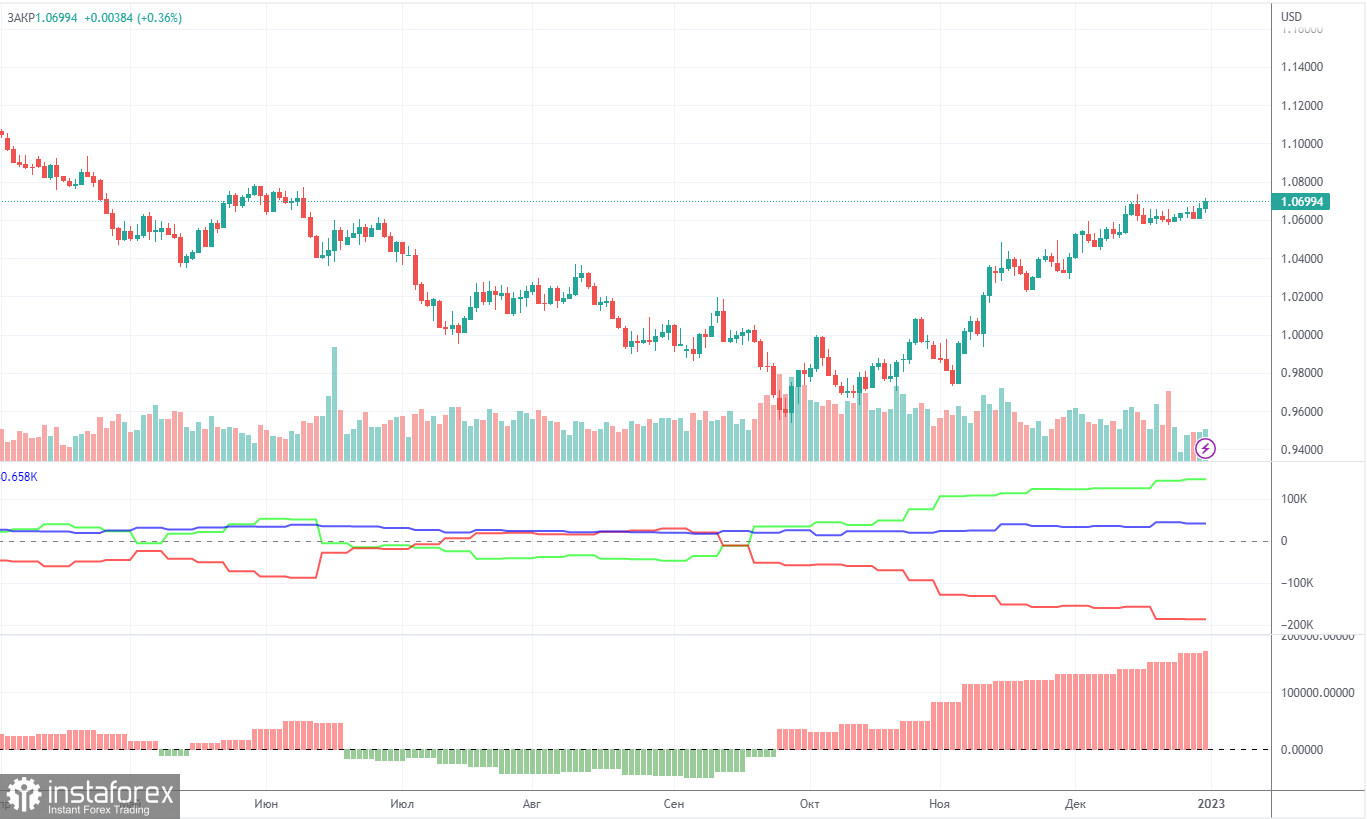
COT report
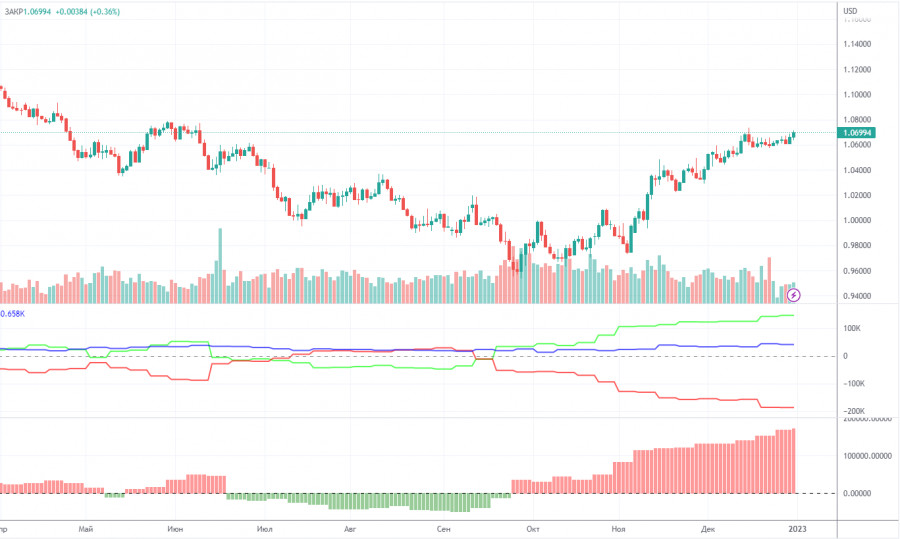
The COT reports for the euro in the last few months have been fully consistent with what is happening in the market. You can clearly see on the chart that the net position of big players (the second indicator) has been growing since early September. Around the same time, the euro started to grow. At this time, the net position of the non-commercial traders has been bullish and strengthens almost every week, but it is a rather high value that allows us to assume that the upward movement will end soon. Notably, the green and red lines of the first indicator have moved far apart from each other, which often means the end of the trend. During the given period, non-commercial traders opened 2,700 long positions, whereas the number of short positions fell by 1,100. Thus, the net positions rose by 3,800. The number of long positions is 146,000 higher than the number of short positions opened by non-commercial traders. So the question now is how long will the big players increase their longs? Moreover, from a technical perspective, a bearish correction should have started a long time ago. In my opinion, this process can not continue for another 2 or 3 months. Even the net position indicator shows that we need to "unload" a bit, that is, to correct. The overall number of short orders exceeds the number of long orders by 41,000 (685,000 vs. 644,000).
H1 chart of EUR/USD
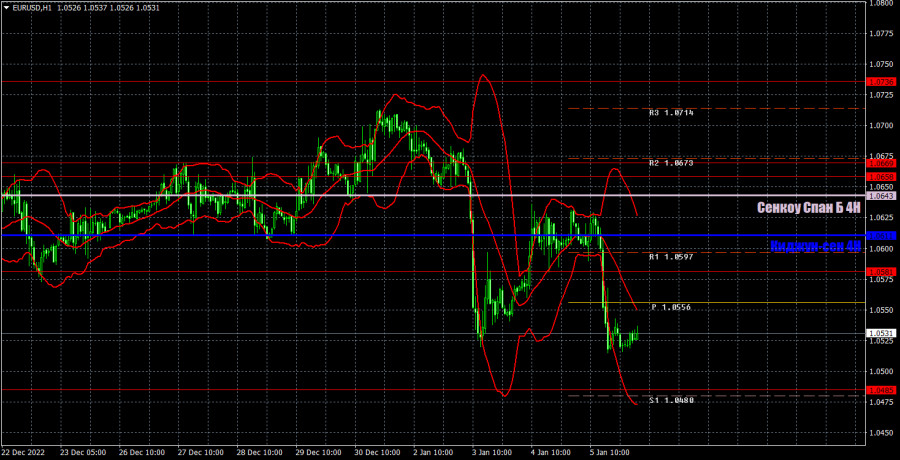
On the one-hour chart, EUR/USD clearly failed to settle above the Senkou Span B and Kijun-Sen lines and failed to stay inside the horizontal channel. Thus, the downtrend persists. Today almost everything will depend on the macroeconomic background, and not only in the US because an important report on EU inflation will also be published during the European session. On Friday, the pair may trade at the following levels: 1.0269, 1.0340-1.0366, 1.0485, 1.0581, 1.0658-1.0669, 1.0736, and also Senkou Span B lines (1.0643) and Kijun Sen (1.0611). Lines of the Ichimoku indicator may move during the day, which should be taken into account when determining trading signals. There are also support and resistance levels, but signals are not formed near these levels. Bounces and breakouts of the extreme levels and lines could act as signals. Don't forget about stop-loss orders, if the price covers 15 pips in the right direction. This will prevent you from losses in case of a false signal. On January 6, there will be several important macro data in the US and one significant report in the EU. Volatility could be very high and the price could reverse several times.
What we see on the trading charts:
Price levels of support and resistance are thick red lines, near which the movement may end. They do not provide trading signals.
The Kijun-sen and Senkou Span B lines are the lines of the Ichimoku indicator, moved to the one-hour chart from the 4-hour one. They are strong lines.
Extreme levels are thin red lines from which the price bounced earlier. They provide trading signals.
Yellow lines are trend lines, trend channels, and any other technical patterns.
Indicator 1 on the COT charts reflects the net position size of each category of traders.
Indicator 2 on the COT charts reflects the net position size for the non-commercial group.