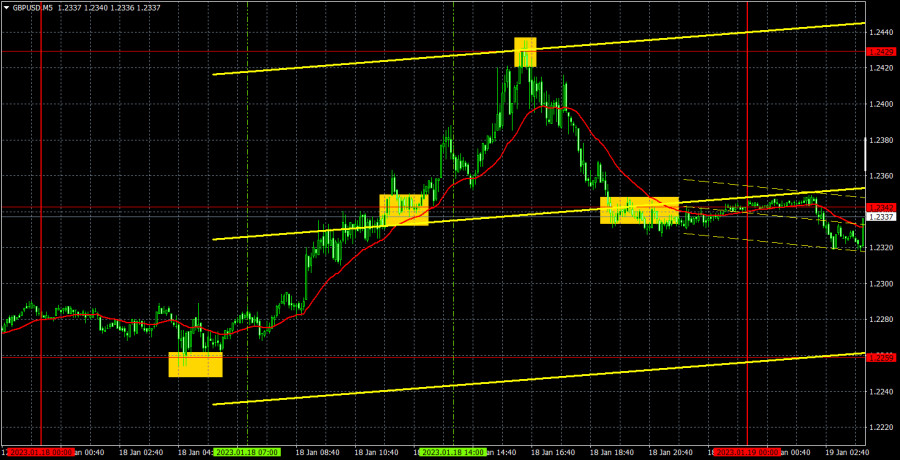
M5 chart of GBP/USD
GBP/USD was rising again for most of the day and at least it corrected for a little bit during the US session. Bank of England Governor Andrew Bailey gave a speech this week, the essence of which was an expression of hope for the fall of the inflation rate in Britain "by itself". I believe it's a dovish factor, but the pound still rose anyway. Yesterday, however, the UK inflation report recorded 10.5% in December, which was completely in line with forecasts, but the pound rose again. By itself, a weak fall in inflation is a bullish factor for the British currency, but at the same time the forecast and the actual value coincided. The market is still taking every opportunity to buy EUR and GBP, so I'm not surprised that both of them strengthened. Reports on industrial production and retail sales came out in the US yesterday, and they were weaker than expected, but the dollar rose steadily in the afternoon. There is still not much logic in the pair's movements.
Speaking of trading signals, yesterday was almost ideal. During the night, the price rebounded from 1.2259 and rose to 1.2429. By the opening of the European trading session, the price moved back no more than 10 pips from the point of formation, so a long position could be opened. It brought profit of not less than 130 pips. The sell signal near 1.2429 also turned out to be a good one, and the price returned to 1.2342 at night, allowing traders to earn about 80 pips more. Even if they didn't wait for a breakout of 1.2342, the deal was still profitable. As a result, two deals and a profit of more than 150 pips. That was a great day!
COT report

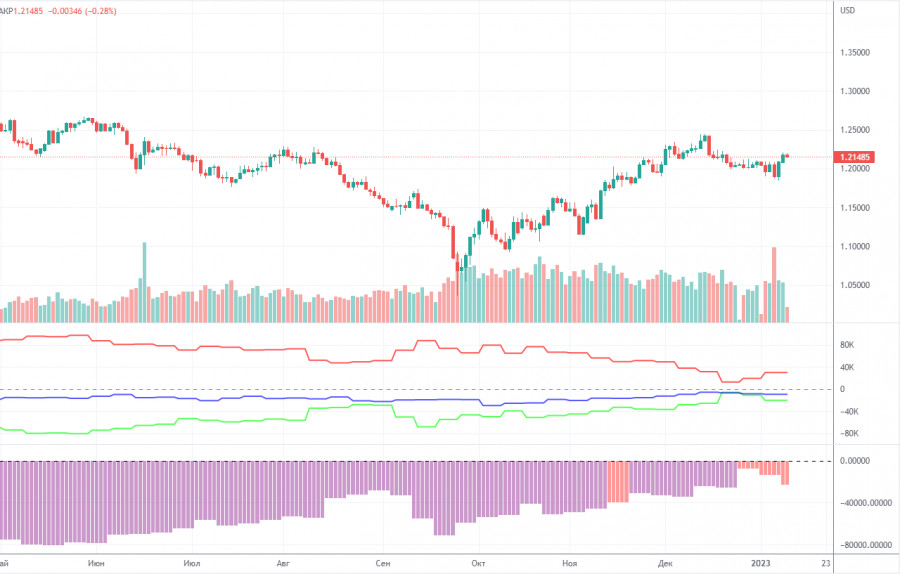
The latest COT report showed an increase in bearish sentiment. During the given period, non-commercial traders closed 7,600 long positions and opened as many as 1,500 short positions. Thus, the net position fell by about 9,100. This figure has been on the rise for several months, and the sentiment may become bullish in the near future, but it hasn't yet. Although the pound has grown against the dollar for the last few months, from a fundamental perspective, it is difficult to answer why it keeps rising. On the other hand, it could fall in the near future (in the mid-term prospect) because it still needs a correction. In general, in recent months the COT reports correspond to the pound's movements so there shouldn't be any questions. Since the net position is not even bullish yet, traders may continue to buy the pair over the next few months. Non-commercial traders now hold 36,000 long positions and 65,500 short ones. I remain skeptical about the pound's long term growth, though there are technical reasons for it. At the same time, fundamental and geopolitical factors signal that the currency is unlikely to strengthen significantly.
H1 chart of GBP/USD

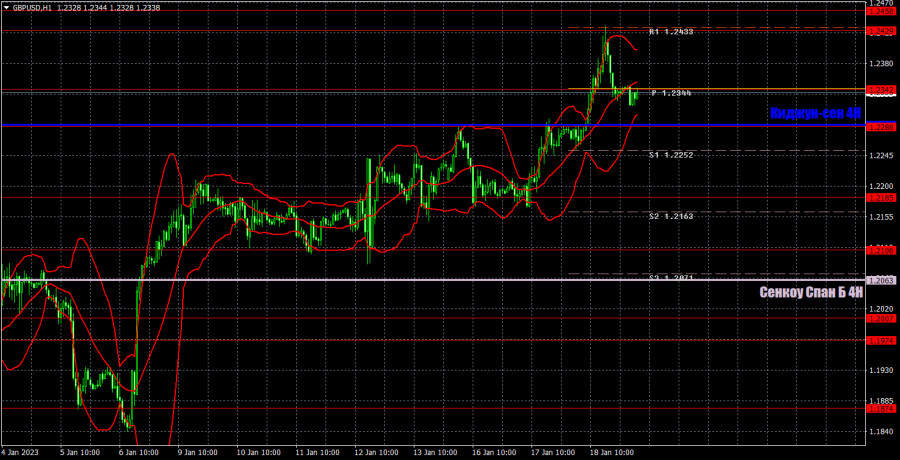
On the one-hour chart, GBP/USD continues to grow, sitting above the Ichimoku indicator lines. There are still few reasons for growth, and the pound has already gained 2100 points in recent months. However the market is still not happy with the USD, so the trend is unambiguous. On January 19, the pair may trade at the following levels: 1.2106, 1.2185, 1.2288, 1.2342, 1.2429-1.2458, 1.2589, 1.2659. The Senkou Span B (1.2063) and Kijun Sen (1.2290) lines may also generate signals. Pullbacks and breakouts through these lines may produce signals as well. A Stop Loss order should be set at the breakeven point after the price passes 20 pips in the right direction. Ichimoku indicator lines may move during the day, which should be taken into account when determining trading signals. In addition, the chart does illustrate support and resistance levels, which could be used to lock in profits. There are no interesting events in the UK on Thursday, and we only have minor reports in the US, which are unlikely to pique interest among traders. A good opportunity for the pound to correct, but will it take advantage of it?
What we see on the trading charts:
Price levels of support and resistance are thick red lines, near which the movement may end. They do not provide trading signals.
The Kijun-sen and Senkou Span B lines are the lines of the Ichimoku indicator, moved to the one-hour chart from the 4-hour one. They are strong lines.
Extreme levels are thin red lines from which the price bounced earlier. They provide trading signals.
Yellow lines are trend lines, trend channels, and any other technical patterns.
Indicator 1 on the COT charts reflects the net position size of each category of traders.
Indicator 2 on the COT charts reflects the net position size for the non-commercial group.


