The EUR/USD pair, following the results of the past week, showed impressive growth, testing the ninth figure. Bulls updated this month's high, reaching 1.0930, but failed to hold steady in this price area. However, despite the downward price pullback, in general, the weekly round ended with the bulls' victory: the opening price was 1.0672, the closing price was 1.0761.
Traders have taken another step to the upside, although the fundamental background for the pair is still very controversial. The situation is in limbo, so the next macroeconomic releases may tip the scales in one direction or another. Either the pair will return to the area of 5-6 figures, or rise again to the 1.0950 mark (the upper line of the Bollinger Bands indicator on the weekly chart), with a claim to the 10th figure.
Busy week
The economic calendar of the upcoming week is full of macroeconomic events. For example, German IFO indices will be published on Monday. Their importance has increased against the backdrop of conflicting PMIs, which were published last week. Let me remind you that Germany's manufacturing PMI was in the red zone, falling to 44.4 points (the lowest value since July 2020). Whereas the services PMI showed the opposite trend, rising to the level of 53.9 (the highest growth rate since May last year). The IFO business environment indicator has shown positive dynamics over the past five months, reaching 91.1 in February. According to preliminary forecasts, in March it will come out at around 90.0, making a "step back" for the first time in 5 months. In this case, the euro will be under certain pressure.
On Tuesday, EUR/USD traders will focus on US reports: the US will publish an indicator of consumer confidence. This indicator has been declining over the past two months, and a decline is also expected in March - to 101.0 points (the lowest value since July 2022). Also, the Richmond Fed manufacturing index may have a certain impact on the pair. In February, it fell to -16 points (the lowest level since June 2020), and should also remain in the negative area (-8) in March, reflecting worsening conditions in the manufacturing sector.
The most significant macro data is the pending home sales index. It is the leading indicator of activity in the US real estate market. After the February growth (by 8%), a decline is expected again in March - by almost 3%.
But the most important day of the week is Friday. Inflation reports will be published on this day, which will reflect the dynamics of inflation in the US and the eurozone.
Most important reports
Here it is necessary to make a small digression. Let me remind you that following the results of the March meetings of the European Central Bank and the Federal Reserve, the central banks actually "tied" their future decisions to inflation. In particular, the ECB raised interest rates by 50 points and was worried about inflation, but did not announce further steps to tighten monetary policy. At the final press conference, ECB President Christine Lagarde noted that the appropriate decisions (on raising rates) will be determined "taking into account incoming economic and financial data, as well as the dynamics of core inflation." The Fed, in turn, indicated that in determining the future prospects for monetary policy, it will "take into account the cumulative volume of monetary tightening and the lagging effects of monetary policy, as well as inflation, economic and financial development."
That is why EUR/USD traders will focus on Friday's data on eurozone inflation and the US PCE index.
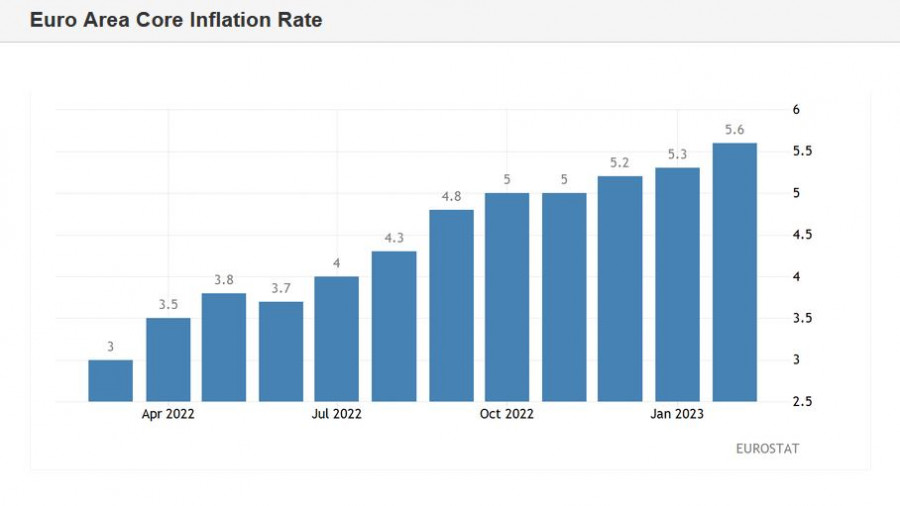
Eurozone headline CPI is forecast to come in at 7.1% year-on-year, reflecting a slowdown in headline inflation, according to preliminary forecasts. But at the same time, the core index, excluding volatile energy and food prices, should show growth again, rising to a record high of 5.7% in March. And in this case, core inflation will play a decisive role, given the previous rhetoric of Lagarde. Therefore, if the core index comes out at least at the level of forecasts (not to mention the green zone), bulls will receive significant support, due to increased hawkish expectations regarding the further actions of the ECB.


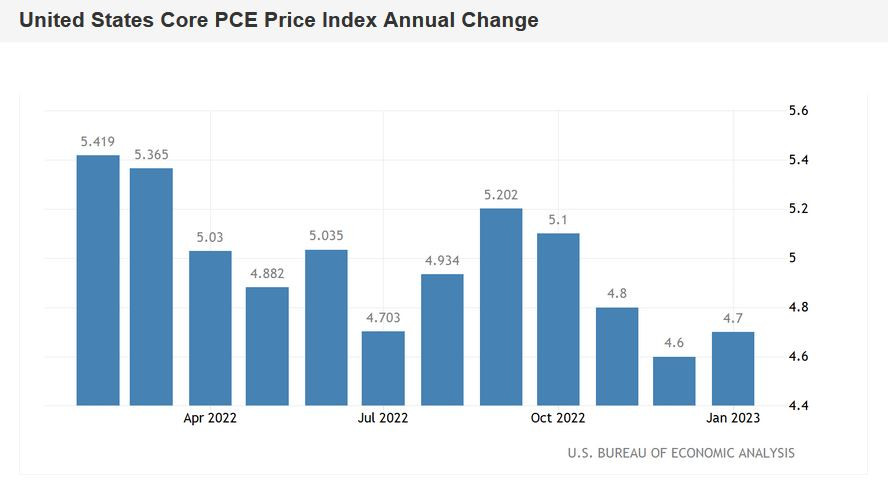
The main index of personal consumption expenditures (PCE) will be published at the start of Friday's US session. This is the most important inflationary indicator closely monitored by the Fed members, and which can provoke increased volatility among dollar pairs - both in favor of the greenback and against it. Over the course of three months (from October to December inclusive), the indicator consistently decreased, but in January it showed a positive trend, reaching 4.7% y/y. According to preliminary forecasts, the February PCE index should come out at around 4.8%. The growth of this index will provide significant support to the dollar, in light of the latest statements by Fed Chairman Jerome Powell regarding the US central bank's actions. If the indicator turns out to be in the green, the probability of a quarter point rate hike following the results of the next (May) meeting will increase significantly.
Conclusions
The coming week is full of macroeconomic events. In addition to the aforementioned data, speeches by representatives of the ECB and the Fed are also expected. From the side of the ECB, Frank Elderson, Isabelle Schnabel, Joachim Nagel and Christine Lagarde will voice their position; from the Fed, Philip Jefferson, Michael Barr, Thomas Barkin, John Williams, Lisa Cook, and Christopher Waller. But, in my opinion, all of them in one form or another will repeat the main theses of the March meetings of the ECB and the Fed, the essence of which is that further decisions regarding monetary policy will depend on the dynamics of inflationary growth. Therefore, it is inflation reports that will play a key role for the EUR/USD pair, at least in the context of medium-term prospects.
In terms of technique, the pair is in the Kumo cloud on the daily chart, between the middle and upper lines of the Bollinger Bands indicator. It is better to consider long positions once the bulls overcome the resistance level of 1.0780, and, respectively, will settle above this price target. This price point corresponds to the upper limit of the Kumo cloud on the daily chart and simultaneously to the Tenkan-sen line on the weekly chart.
The target for the upward movement is 1.0950, which corresponds to the upper line of the Bollinger Bands indicator on the weekly chart.


