empty
06.04.2023 12:05 PM
EUR/USD and GBP/USD: trading plan for beginners on April 6, 2023

Macroeconomic calendar from April 5

Yesterday, final business activity figures were published for the eurozone, the United Kingdom, and the United States. In the eurozone, the services PMI rose to 55.0 from 52.7, and the composite index increased to 53.7 from 52.0. Economists had expected growth of 54.1. In the United Kingdom, business activity in the services sector fell to 52.9 from 53.5, and the composite index dropped to 52.2 from 53.1. In the United States, the services PMI accelerated to 52.6 from 50.6, less than the expected 53.8. The composite index advanced to 52.3 from 50.1.

The United States published data on ADP employment change, which revealed an increase of just 145,000 in March, which may indicate a possible slowdown in economic growth or a recession in the United States. Economists had forecasted figures to rise by 210,000, while growth in the previous reporting period was 261,000.

Analysis of trading charts from April 5

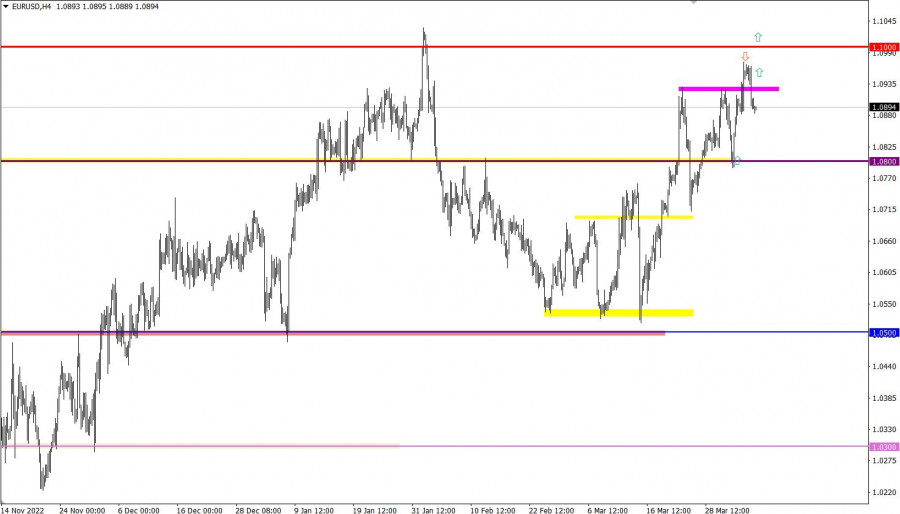
The euro/dollar pair is in a retracement phase after reaching a weekly swing high. As a result, the quotes dropped below the 1.0900 level, but the upward trend persists in the market.

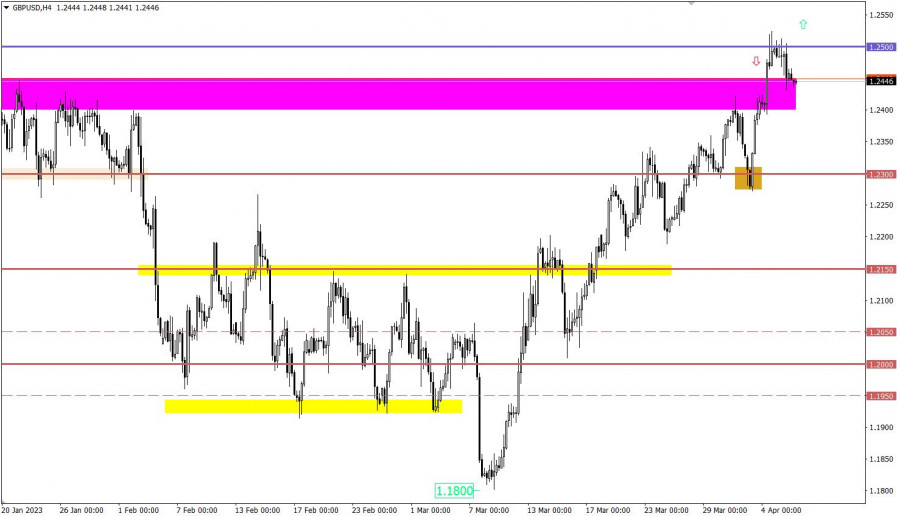
The pound/dollar pair recently reached the swing high of the medium-term upward trend. As a result, the quotes temporarily went above the 1.2500 mark, but due to an overbought signal, they entered a retracement phase.

This image is no longer relevant

Macroeconomic calendar on April 6

It is expected that the volume of US jobless claims will increase. Continuing claims are forecast to go up to 1,699,000 from 1,689,000, initial claims are set to rise from 198,000 to 200,000. These data are seen as a negative factor for the US labor market and may affect market sentiment.

Trading plan for EUR/USD on April 6

Buyers face significant resistance near the psychologically important level of 1.1000, which leads to a reduction in the volume of long positions. However, the current retracement may shift trading forces, which will positively affect the overall trend. It is expected that the volume of long positions will increase after the price returns above the 1.0950 mark, targeting the 1.1000 level. The retracement phase continues for now.

This image is no longer relevant

Trading plan for GBP/USD on April 6

The 1.2500 level serves as resistance for buyers and was reached by the price, A retracement occurred in the market afterward. Such a retracement may trigger a shift in trading forces. In case the price returns above the 1.2500 level, it will become possible to buy the pound sterling. However, as long as the quote is in the retracement phase, holding the price above the control level will be challenging.

This image is no longer relevant

What's on technical charts

The candlestick chart shows graphical white and black rectangles with upward and downward lines. While conducting a detailed analysis of each individual candlestick, it is possible to notice its features intrinsic to a particular time frame: the opening price, the closing price, and the highest and lowest price.

Horizontal levels are price levels, in relation to which a stop or reversal of the price may occur. They are called support and resistance levels.

Circles and rectangles are highlighted examples where the price reversed in the course of its history. This color highlighting indicates horizontal lines which can exert pressure on prices in the future.

Upward/downward arrows signal a possible future price direction.

Gven Podolsky,
Especialista em análise na InstaForex
© 2007-2025
Summary
Urgency
Analytic
Vladislav Tukhmenev
Start trade
Ganhe com as variações das taxas das criptomoedas com a InstaForex.
Baixe o MetaTrader 4 e abra a sua primeira operação.
  • Grand Choice
    Contest by
    InstaForex
    InstaForex always strives to help you
    fulfill your biggest dreams.
    PARTICIPE DO CONCURSO

Recommended Stories

How to Trade GBP/USD on July 11h? Simple Tips and Trade Analysis for Beginners

Na quinta-feira, o par GBP/USD manteve sua trajetória de queda, espelhando o comportamento do EUR/USD. O movimento dessas duas principais paridades cambiais tem sido praticamente idêntico ao longo da semana

Paolo Greco 17:34 2025-07-11 UTC+2

Como negociar EUR/USD em 11 de julho? Dicas simples e análise de negociação para iniciantes

Na quinta-feira, o par EUR/USD manteve seu movimento de queda moderado, em linha com a tendência atual. Temos reiterado essa mesma avaliação ao longo da semana porque, de fato, pouca

Paolo Greco 16:28 2025-07-11 UTC+2

O par de moedas EUR/USD foi negociado em baixa na segunda-feira, com o dólar americano mostrando uma força notável

Análise das negociações de segunda-feira: EUR/USD, Gráfico 1H Na segunda-feira, o par EUR/USD operou com viés de baixa, e o dólar norte-americano registrou um ganho relativamente forte. Como já mencionamos

Paolo Greco 16:13 2025-07-08 UTC+2

GBP/USD: Plano de Negociação para a Sessão dos E.U.A. de 7 de julho (Revisão das Negociações da Manhã)

Na minha previsão da manhã, destaquei o nível 1,3602 e planejei usá-lo para determinar os pontos de entrada no mercado. Vamos dar uma olhada no gráfico de 5 minutos

Miroslaw Bawulski 17:53 2025-07-07 UTC+2

EUR/USD: Plano de Negociação para a Sessão dos E.U. de 7 de julho (Revisão das Negociações da Manhã)

Na minha previsão da manhã, destaquei o nível 1,1749 e planejei basear as decisões de entrada no mercado em torno dele. Vamos dar uma olhada no gráfico de 5 minutos

Miroslaw Bawulski 17:44 2025-07-07 UTC+2

Como negociar o par EUR/USD em 4 de julho? Dicas simples e análise de negociação para iniciantes

Análise das operações de quinta-feira Gráfico 1H do EUR/USD O EUR/USD operou de forma estável ao longo da quinta-feira, tanto antes quanto depois da divulgação dos dados de emprego

Paolo Greco 14:57 2025-07-04 UTC+2

GBP/USD: Plano de Negociação para a Sessão dos E.U.A de 1º de julho (Revisão das Negociações da Manhã)

Na minha previsão da manhã, concentrei-me no nível 1,3766 e planejei tomar decisões de negociação a partir desse ponto. Vamos dar uma olhada no gráfico de 5 minutos

Miroslaw Bawulski 20:44 2025-07-01 UTC+2

EUR/USD: Plano de Negociação para a Sessão dos E.U. de 1º de julho (Revisão das Negociações da Manhã)

Na minha previsão da manhã, destaquei o nível de 1,1806 como ponto de referência para tomadas de decisão nas operações. Vamos dar uma olhada no gráfico de 5 minutos

Miroslaw Bawulski 20:24 2025-07-01 UTC+2
Não pode falar agora?
Faça sua pergunta no chat.
Widget callback
 

Dear visitor,

Your IP address shows that you are currently located in the USA. If you are a resident of the United States, you are prohibited from using the services of InstaFintech Group including online trading, online transfers, deposit/withdrawal of funds, etc.

If you think you are seeing this message by mistake and your location is not the US, kindly proceed to the website. Otherwise, you must leave the website in order to comply with government restrictions.

Why does your IP address show your location as the USA?

  • - you are using a VPN provided by a hosting company based in the United States;
  • - your IP does not have proper WHOIS records;
  • - an error occurred in the WHOIS geolocation database.

Please confirm whether you are a US resident or not by clicking the relevant button below. If you choose the wrong option, being a US resident, you will not be able to open an account with InstaForex anyway.

We are sorry for any inconvenience caused by this message.