empty
29.09.2023 11:24 PM
Technical analysis on GBP/USD for September 29, 2023

This image is no longer relevant

Overview :

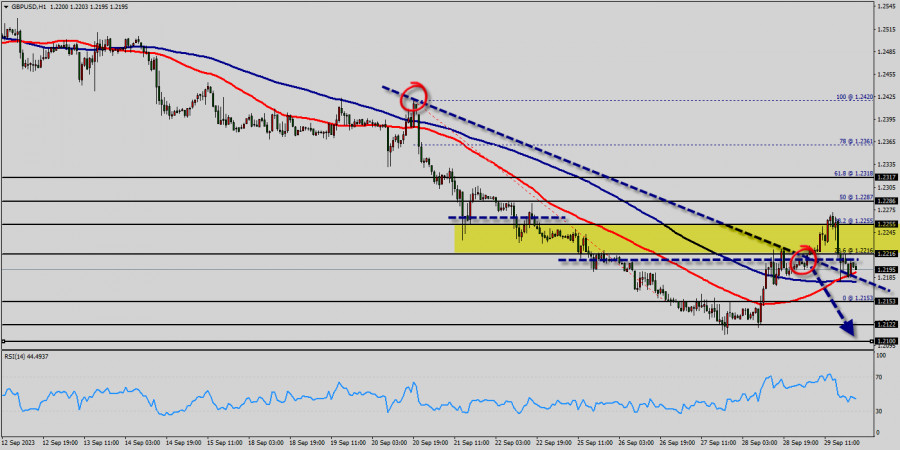
The GBP/USD pair will continue rising from the level of 1.2195 5today. So, the support is found at the level of 1.2153. Since the trend is above the 23.6% Fibonacci level, the market is still in an uptrend. Therefore, the GBP/USD pair is continuing with a bullish trend from the new support of 1.2153. The current price is set at the level of 1.2423 that acts as a daily pivot point seen at 1.2434.

Equally important, the price is in a bullish channel. According to the previous events, we expect the GBP/USD pair to move between 1.2495 and 1.2153. This would suggest a bullish market because the RSI indicator is still in a positive area and does not show any trend-reversal signs. Therefore, strong support will be formed at the level of 1.2195 5providing a clear signal to buy with the target seen at 1.2460.

If the trend breaks the resistance at 1.2460 (first resistance), the pair will move upwards continuing the development of the bullish trend to the level 1.2495 in order to test the daily resistance 2. In the same time frame, resistance is seen at the levels of 1.2495 and 1.2500. The stop loss should always be taken into account for that it will be reasonable to set your stop loss at the level of 1.2326 (below the support 2).

If the price of Pound Sterling is trading above 1.2583 then possibility of upside targets getting achieved is higher around the level of 1.2783. The basic bullish trend is very strong on the GBP/USD pair, but the short term shows some signs of running out of steam. Nevertheless, a purchase could be considered as long as the price remains above 1.2461.

Crossing the first resistance at 1.2583 would be a sign of a potential new surge in the price. Buyers would then use the next resistance located at 1.2583 as an objective. Crossing it would then enable buyers to target 1.2583. Caution, a return to below 1.2583 would be a sign of a consolidation phase in the short-term basic trend. If this is the case, remember that trading against the trend may be riskier. It would seem more appropriate to wait for a signal indicating reversal of the trend. In the very short term, the general bullish sentiment is not called into question, despite technical indicators being indecisive.

All elements being clearly bullish market, it would be possible for traders to trade only long positions on the GBP/USD pair as long as the price remains well above the price of 1.2461. A bullish break in this resistance would boost the bullish momentum. The buyers could then target the resistance located at 1.2583. This suggests that the pair will probably go up in coming hours. If the trend is able to break the level of 1.2583 (double top), then the market will call for a strong bullish market towards the objective of 1.2615 this week.

Mourad El Keddani,
Especialista em análise na InstaForex
© 2007-2025
Summary
Urgency
Analytic
Mourad El Keddani
Start trade
Ganhe com as variações das taxas das criptomoedas com a InstaForex.
Baixe o MetaTrader 4 e abra a sua primeira operação.
  • Grand Choice
    Contest by
    InstaForex
    InstaForex always strives to help you
    fulfill your biggest dreams.
    PARTICIPE DO CONCURSO

Recommended Stories

Sinais de negociação para o EUR/USD para 22-25 de julho de 2025: venda abaixo de 1,1718 ( EMA 200 - 8/8 de Murray)

O indicador Eagle tem mostrado sinais de sobrevenda desde 15 de julho. No entanto, o ciclo de baixa pode ser retomado, já que o euro está mostrando sinais de exaustão

Dimitrios Zappas 16:32 2025-07-22 UTC+2

Previsão para o GBP/USD para 22 de julho de 2025

A libra britânica ganhou 80 pips ontem, mas esse movimento parece não ter sido bem formado - foi apenas mais um teste da linha de equilíbrio, e hoje começou

Laurie Bailey 16:28 2025-07-22 UTC+2

Previsão para o AUD/USD para 22 de julho de 2025

Vamos examinar o gráfico semanal do par AUD/USD. Na semana de 7 a 11 de julho, o preço se consolidou acima da linha MACD e da linha interna do canal

Laurie Bailey 16:24 2025-07-22 UTC+2

GBP/USD - 22 de julho: A libra interrompe a tendência de baixa

No gráfico horário, o par GBP/USD registrou uma nova reversão a favor da libra na segunda-feira e se consolidou acima do nível de Fibonacci de 76,4% em 1,3470, levando

Samir Klishi 15:47 2025-07-22 UTC+2

Sinais de negociação para o OURO (XAU/USD) para 22-25 de julho de 2025: compre acima de $3.380 e venda abaixo de $3.370 (EMA 200 - 7/8 de Murray)

Após romper a forte resistência no nível 6/8 de Murray, o ouro avançou com força e atingiu o nível 7/8, próximo de US$ 3.400. No entanto, essa região representa

Dimitrios Zappas 15:15 2025-07-22 UTC+2

Sinais de negociação para o BITCOIN para 22-25 de julho de 2025: comprar acima de $115.625 (/8 Murray - SMA 21)

O Bitcoin está sendo negociado próximo de US$ 117.522, recuperando-se após atingir a mínima de US$ 116.070. Ontem, durante a sessão europeia, chegou a uma máxima de US$ 119.500

Dimitrios Zappas 15:11 2025-07-22 UTC+2

EUR/USD - 22 de julho: Tarifas de 30% para a União Europeia

Na segunda-feira, o par EUR/USD retomou seu movimento de alta depois de se consolidar acima do nível 1,1645, como eu havia alertado anteriormente. Uma recuperação do nível de Fibonacci

Samir Klishi 14:55 2025-07-22 UTC+2

Sinais de negociação para o BITCOIN para 21-25 de julho de 2025: venda abaixo de $119,00 (6/8 de Murray - SMA 21)

Se o preço do Bitcoin encontrar forte resistência abaixo de US$ 119.000, é provável que retome seu ciclo de baixa, e podemos esperar que atinja a EMA 200 localizada perto

Dimitrios Zappas 22:37 2025-07-21 UTC+2

EUR/USD. 21 de julho. Reunião do BCE não deve trazer mudanças

Na sexta-feira, o par EUR/USD continuou seu movimento para cima após duas recuperações do nível de retração Fibonacci de 100,0% em 1,1574. A consolidação acima do nível 1,1645 não levou

Samir Klishi 18:29 2025-07-21 UTC+2

Se o Kiwi conseguir quebrar acima do seu nível de pivô, o Kiwi tem o potencial de se fortalecer hoje, segunda-feira, 21 de julho de 2025

NZD/USD – Segunda-feira, 21 de julho de 2025 Embora tecnicamente todos os indicadores ainda apontem para fraqueza, o surgimento de uma divergência entre o movimento do preço e o indicador

Arief Makmur 17:44 2025-07-21 UTC+2
Não pode falar agora?
Faça sua pergunta no chat.
Widget callback
 

Dear visitor,

Your IP address shows that you are currently located in the USA. If you are a resident of the United States, you are prohibited from using the services of InstaFintech Group including online trading, online transfers, deposit/withdrawal of funds, etc.

If you think you are seeing this message by mistake and your location is not the US, kindly proceed to the website. Otherwise, you must leave the website in order to comply with government restrictions.

Why does your IP address show your location as the USA?

  • - you are using a VPN provided by a hosting company based in the United States;
  • - your IP does not have proper WHOIS records;
  • - an error occurred in the WHOIS geolocation database.

Please confirm whether you are a US resident or not by clicking the relevant button below. If you choose the wrong option, being a US resident, you will not be able to open an account with InstaForex anyway.

We are sorry for any inconvenience caused by this message.