empty
02.05.2023 07:28 AM
GBP/USD: Forecast and trading signals on May 2. COT report. Detailed analysis of price movement and trades. The pound maintains a new uptrend

5M chart of GBP/USD

This image is no longer relevant

The GBP/USD pair also fell in the second half of Monday, but thanks to Friday's movement, it remained above the Ichimoku indicator lines. On the one-hour chart, we did not even form a new trend line, because they currently have no meaning. Overcoming the previous three ascending lines did not lead to a strong decline. The pound continues to move in a very chaotic manner. Yesterday, the US business activity reports and traders' favor came to the dollar's aid. Recently, many reports that have been in favor of the dollar were interpreted by the market in the opposite direction. The euro and pound remain extremely overbought but are reluctant to fall. Thus, Monday did not change the overall situation in the market; the pair only slightly edged down.

Speaking of yesterday's trading signals, they were not the best. During the European trading session, the price bounced off the 1.2520 level three times. Each buy signal duplicated the previous one, so only one long position should have been opened. The pound managed to rise by around 25 points, so a breakeven Stop Loss should have been set for long positions. The deal closed at this order when the pair returned to 1.2520. Then there was a sell signal when the pair crossed the 1.2520 level, followed by a decline to the critical line and a bounce from it. However, the level and line were very close to each other, and when the signal was formed, there were only 15 points left to reach the target. Therefore, this signal should not have been executed.

COT report:

This image is no longer relevant

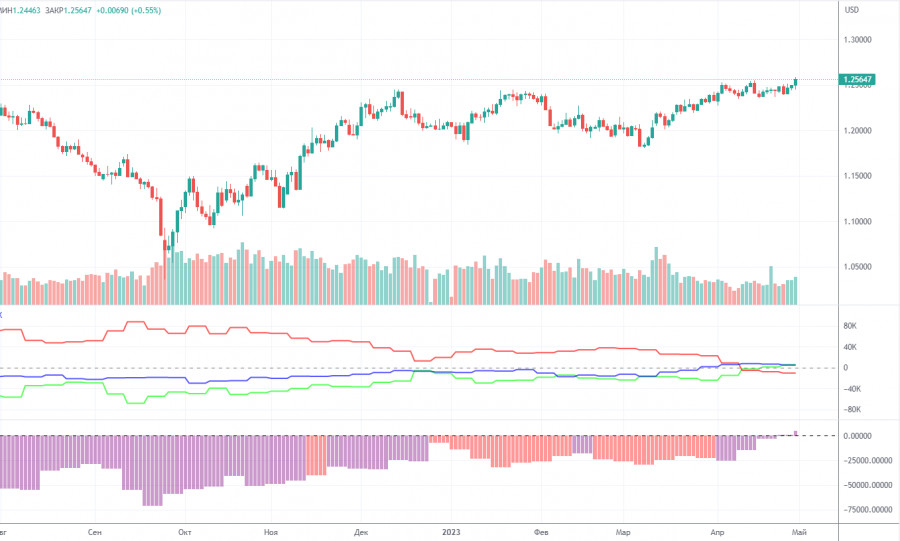
According to the latest COT report on the British pound, the non-commercial group of traders opened 5,600 long positions and 1,000 shorts. As a result, the net position of the non-commercial group traders has increased by 4,600 and continues to grow. The net position has been steadily rising for the past 8-9 months, but the sentiment of major market players remained bearish during this time. Now it can be called bullish to some extent. Although the British pound is strengthening against the US dollar in the medium term, it is hard to explain this behavior from the fundamental point of view. There is still the possibility of a sharp decline in the pound. Both major pairs are moving in a similar way now, but the net position of the euro is positive and even implies the imminent completion of the upward momentum, while for the pound, it still suggests further growth. The British currency has already risen by more than 2,100 points, which is a lot, and without a strong bearish correction, the continuation of growth would be absolutely illogical. The non-commercial group of traders currently has a total of 53,500 shorts and 59,500 longs. I remain skeptical about the long-term growth of the British currency and expect it to decline.

1H chart of GBP/USD

This image is no longer relevant

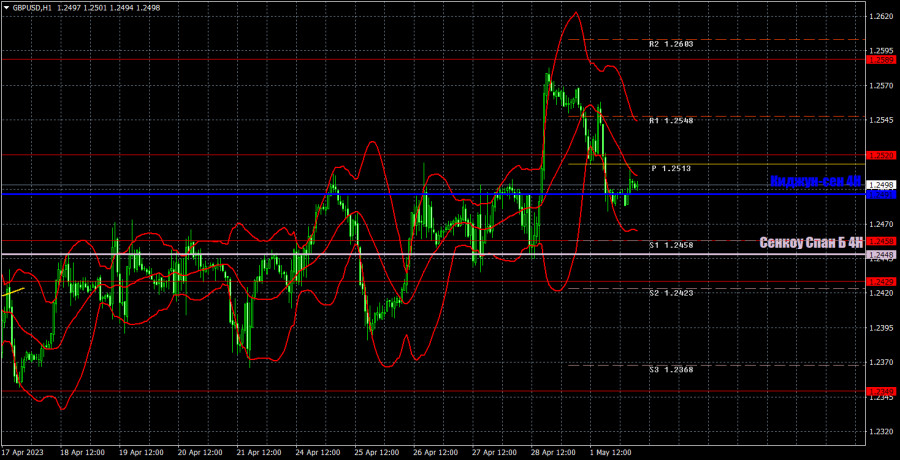
On the one-hour chart, GBP/USD pair resumed its unfounded upward movement but still continues to move from side to side. The pound has not been able to show a significant decline after overcoming the next uptrend line. At this time, it is possible to form the fourth consecutive ascending trend line, which will have no meaning, and even if the price overcomes it, it still wouldn't lead to a decline. In the short term, the pair continues to alternate between falling and rising, ignoring all incoming information.For May 2, we highlight the following important levels: 1.2185, 1.2269, 1.2349, 1.2429-1.2458, 1.2520, 1.2589, 1.2659, 1.2762. Senkou Span B (1.2448) and Kijun-sen (1.2491) lines can also generate signals. Rebounds and breakouts from these lines can also serve as trading signals. It is better to set the Stop Loss at breakeven as soon as the price moves by 20 pips in the right direction. The lines of the Ichimoku indicator can change their position throughout the day which is worth keeping in mind when looking for trading signals. On the chart, you can also see support and resistance levels where you can take profit. On Tuesday, the UK will release its Manufacturing PMI, while the US will publish its JOLTs job openings report. Both of these reports are likely to not provoke a strong market reaction.

Indicators on charts:

Resistance/support - thick red lines, near which the trend may stop. They do not make trading signals.

Kijun-sen and Senkou Span B are the Ichimoku indicator lines moved to the hourly timeframe from the 4-hour timeframe. They are also strong lines.

Extreme levels are thin red lines, from which the price used to bounce earlier. They can produce trading signals.

Yellow lines are trend lines, trend channels, and any other technical patterns.

Indicator 1 on the COT chart is the size of the net position of each trader category.

Indicator 2 on the COT chart is the size of the net position for the Non-commercial group of traders.

Paolo Greco,
Especialista em análise na InstaForex
© 2007-2025
Selecionar intervalo de tempo
5
min
15
min
30
min
1
hora
4
horas
1
dia
1
s.
Ganhe com as variações das taxas das criptomoedas com a InstaForex.
Baixe o MetaTrader 4 e abra a sua primeira operação.
  • Grand Choice
    Contest by
    InstaForex
    InstaForex always strives to help you
    fulfill your biggest dreams.
    PARTICIPE DO CONCURSO

Recommended Stories

Recomendações de negociação e análise para o GBP/USD em 20 de março: Reunião do Banco da Inglaterra em breve

O par GBP/USD continuou sendo negociado dentro da mesma faixa na quarta-feira. Apesar da reunião do Fed, do discurso de Jerome Powell e da atualização do dot-plot, o mercado

Paolo Greco 16:47 2025-03-20 UTC+2

EUR/USD: Plano de Negociação para a Sessão dos E.U.A. de 14 de março (Revisão das Negociações da Manhã)

Na minha previsão da manhã, foquei no nível 1,0852 e planejei basear minhas decisões de negociação nele. Vamos examinar o gráfico de 5 minutos para ver o que aconteceu

Miroslaw Bawulski 21:10 2025-03-14 UTC+2

GBP/USD: Plano de Negociação para a Sessão dos E.U. de 11 de março (Análise das Negociações da Manhã). Compradores de Libra buscam uma nova máxima semanal

Na minha previsão da manhã, concentrei-me no nível 1,2876 e planejei tomar decisões de negociação com base nele. Vamos dar uma olhada no gráfico de 5 minutos e analisar

Miroslaw Bawulski 20:53 2025-03-11 UTC+2

EUR/USD: Plano de Negociação para a Sessão dos E.U. de 11 de março (Revisão das Negociações da Manhã). O euro continuou a subir e atualizou sua alta semanal

Na minha previsão da manhã, foquei no nível de 1,0886 e planejei tomar decisões de negociação com base nele. Vamos dar uma olhada no gráfico de 5 minutos e analisar

Miroslaw Bawulski 20:43 2025-03-11 UTC+2

Como negociar o GBP/USD em 7 de março? Dicas simples e análise de negociação para iniciantes

O par GBP/USD também se estabilizou na quinta-feira. Não houve razões fundamentais ou macroeconômicas que justificassem a alta ou queda da libra esterlina ou do dólar americano

Paolo Greco 16:17 2025-03-07 UTC+2

GBP/USD: Plano de Negociação para a Sessão dos E.U.A de 18 de fevereiro (Revisão das Negociações da Manhã)

Em minha previsão matinal, foquei no nível 1,2627 como um ponto-chave para as decisões de entrada no mercado. Olhando para o gráfico de 5 minutos, o par se moveu mais

Miroslaw Bawulski 16:52 2025-02-18 UTC+2

GBP/USD: Plano de negociação para a sessão dos E.U.A. de 14 de fevereiro (revisão da negociação da manhã)

Na minha previsão da manhã, foquei no nível 1,2568 e planejei tomar decisões de negociação com base nele. Vamos dar uma olhada no gráfico de 5 minutos e analisar

Miroslaw Bawulski 22:05 2025-02-14 UTC+2

GBP/USD: Plano de negociação para a sessão dos E.U.A. de 13 de fevereiro (análise das negociações da manhã)

Na minha previsão da manhã, me concentrei no nível 1,2505 e planejei tomar decisões de negociação com base nele. Vamos examinar o gráfico de 5 minutos para

Miroslaw Bawulski 21:41 2025-02-13 UTC+2

EUR/USD: Plano de negociação para a sessão dos E.U.A. de 13 de fevereiro (análise das negociações da manhã)

Na minha previsão da manhã, concentrei-me no nível 1,0440 e planejei tomar decisões de negociação com base nele. Vamos examinar o gráfico de 5 minutos para ver o que aconteceu

Miroslaw Bawulski 20:03 2025-02-13 UTC+2

Recomendações e análise de negociação para o GBP/USD em 10 de fevereiro

O par GBP/USD voltou a se recuperar a partir de sua linha de tendência ascendente na sexta-feira, sugerindo uma possível continuação da tendência de alta. Na segunda-feira, o par sofreu

Paolo Greco 16:51 2025-02-10 UTC+2
Não pode falar agora?
Faça sua pergunta no chat.
Widget callback
 

Dear visitor,

Your IP address shows that you are currently located in the USA. If you are a resident of the United States, you are prohibited from using the services of InstaFintech Group including online trading, online transfers, deposit/withdrawal of funds, etc.

If you think you are seeing this message by mistake and your location is not the US, kindly proceed to the website. Otherwise, you must leave the website in order to comply with government restrictions.

Why does your IP address show your location as the USA?

  • - you are using a VPN provided by a hosting company based in the United States;
  • - your IP does not have proper WHOIS records;
  • - an error occurred in the WHOIS geolocation database.

Please confirm whether you are a US resident or not by clicking the relevant button below. If you choose the wrong option, being a US resident, you will not be able to open an account with InstaForex anyway.

We are sorry for any inconvenience caused by this message.