5M chart of EUR/USD
The EUR/USD pair showed quite strange movements on Tuesday. Although, from a macroeconomic perspective, for the first time in a long time, they were quite logical. Yesterday, I pointed out several reports to pay attention to. As it happened, the most important one - the eurozone inflation report - turned out to be the most neutral and did not provoke any reaction. However, the report on retail sales in Germany was much worse than forecasts and caused the euro to fall in the first half of the day. During the US session, the JOLTs report on changes in the number of job vacancies in the US labor market was published, which turned out to be significantly worse than forecasts and caused the dollar to fall. Overall, volatility was quite low again - no more than 65 points. On the hourly chart, we witnessed "swings" again, albeit with a certain downward slope. The market has become more logically responsive to reports, but this hasn't made it easier for traders.
All of the trading signals were formed around the Senkou Span B line. All of them turned out to be false, and the price seemed to ignore this line. Therefore, traders could only work with the first two signals, but in both cases, the pair couldn't even pass the right direction by 15 points. A small loss was incurred in both cases. However, traders shouldn't be too upset about this. Even stronger movements on Tuesday would not have yielded profits, since the pair couldn't reach the target levels.
COT report:
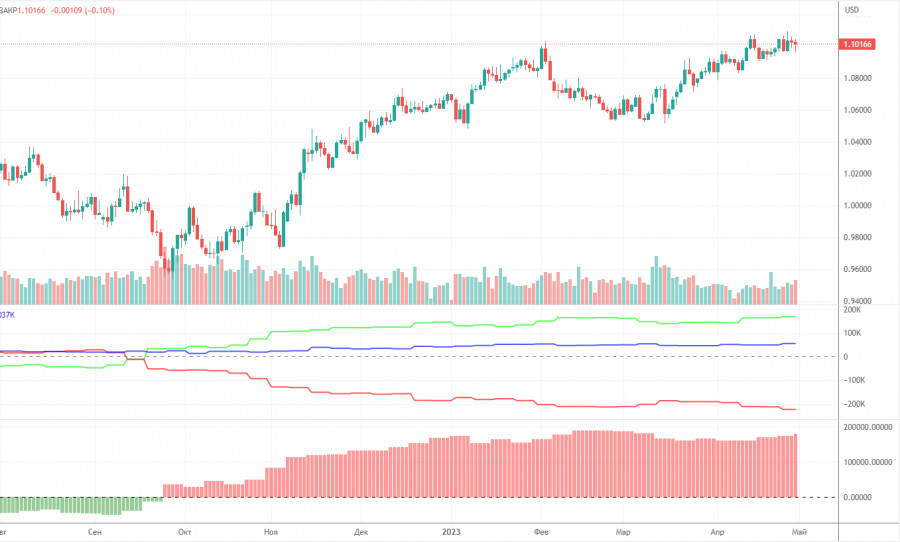
On Friday, a new COT report for April 25 was released. In the last 8-9 months, the COT reports have perfectly reflected what has been happening in the market. The charts above clearly show that the net position of large traders (the second indicator) began to increase in September 2022. At about the same time, the euro resumed a bullish bias. Currently, the net position of non-commercial traders is bullish and remains very high. It boosts further growth of the euro. The high level of the net position signals the competition of the uptrend. The first indicator also points to such a scenario. The red and green lines are very far from each other, which often happens before the end of the trend. The euro tried to resume a downward movement. However, so far, we have seen only a pullback. During the last reporting week, the number of long positions of the non-commercial group of traders increased by 1,100 and the number of short ones dropped by 3,900. The net position advanced by 5,000 contracts. The number of long positions is bigger than the number of short ones. Non-commercial traders already have opened 169,000 long positions. The gap is almost threefold. Investors are still unable to start a correction. Even without COT reports, it is clear that the pair is likely to resume a new fall. Yet, currently, bullish momentum is strong.
1H chart of EUR/USD
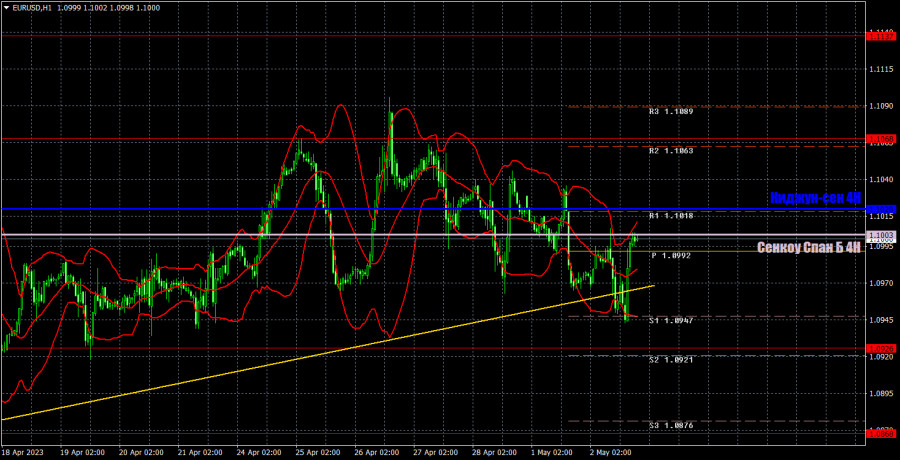
On the one-hour chart, the pair is moving very strangely again. The pair surpassed the uptrend line, but it didn't fall further due to weak US data. The pair constantly bounces back up, corrects, and rides on "swings," significantly complicating the trading process. Now is not the best time to trade, and the remaining three days of the week promise to be "crazy." On Wednesday, important levels are seen at 1.0762, 1.0806, 1.0868, 1.0926, 1.1068, 1.1137-1.1185, 1.1234, 1.1274, as well as Senkou Span B (1.0993) and Kijun-sen (1.1029) lines. Ichimoku indicator lines can move intraday, which should be taken into account when determining trading signals. There are also support and resistance although no signals are made near these levels. They could be made when the price either breaks or rebounds from these extreme levels. Do not forget to place Stop Loss at the breakeven point when the price goes by 15 pips in the right direction. In case of a false breakout, it could save you from possible losses. On May 3, a low-significance unemployment report will be published in the European Union, and more important ADP and ISM reports in the US. Although we expect the market to react only to the ISM business activity index in the service sector. In the evening, we have the Federal Reserve meeting, rate decision, and press conference with Chairman Jerome Powell.
Indicators on charts:
Resistance/support - thick red lines, near which the trend may stop. They do not make trading signals.
Kijun-sen and Senkou Span B are the Ichimoku indicator lines moved to the hourly timeframe from the 4-hour timeframe. They are also strong lines.
Extreme levels are thin red lines, from which the price used to bounce earlier. They can produce trading signals.
Yellow lines are trend lines, trend channels, and any other technical patterns.
Indicator 1 on the COT chart is the size of the net position of each trader category.
Indicator 2 on the COT chart is the size of the net position for the Non-commercial group of traders.


