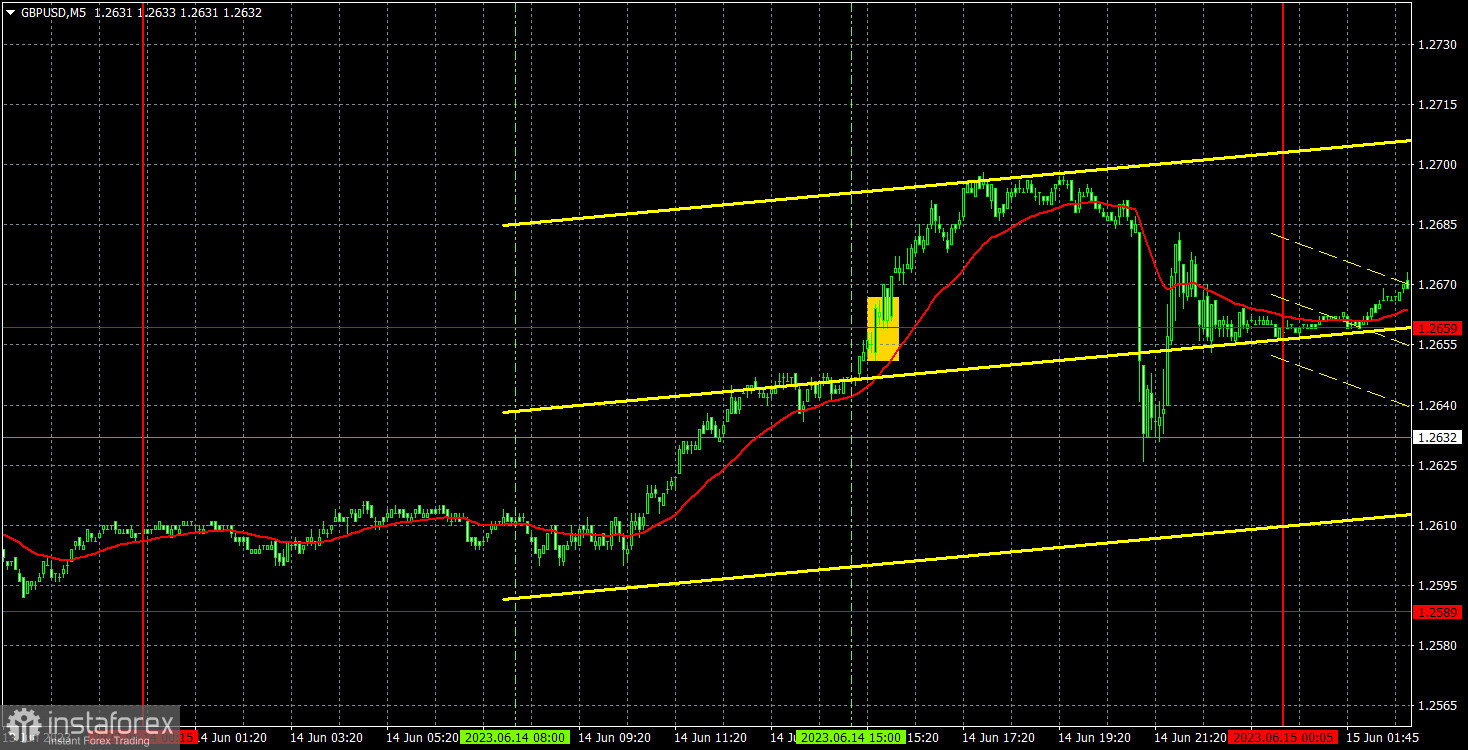
Analysis of GBP/USD 5M.
The GBP/USD pair resumed its upward movement on Wednesday and only rolled back a little by the end of the day. The drop occurred after the Fed meeting. However, later, the pair rebounded amid the same event. The UK did not reveal any important reports yesterday. The realized macro stats were weak. Thus, the pound sterling is unlikely to have been growing since the morning amid domestic reports. So, its rise was mainly associated with the first pause in the Fed's aggressive tightening. The US dollar declined markedly. The pound/dollar pair is now trading at its annual highs.
Yesterday, the pair climbed in the morning. However, it failed to develop a steady upward movement. The pair did not reach 1.2589. If it had bounced off this level, there would have been a buy signal. Therefore, the first entry point appeared at 1.2659 when the pair had already risen by about 70 pips. Given the average volatility in recent years, similarly strong growth would hardly take place. It was necessary to close this transaction manually before the Fed meeting. Traders earned about 25-30 pips, which was a good result.
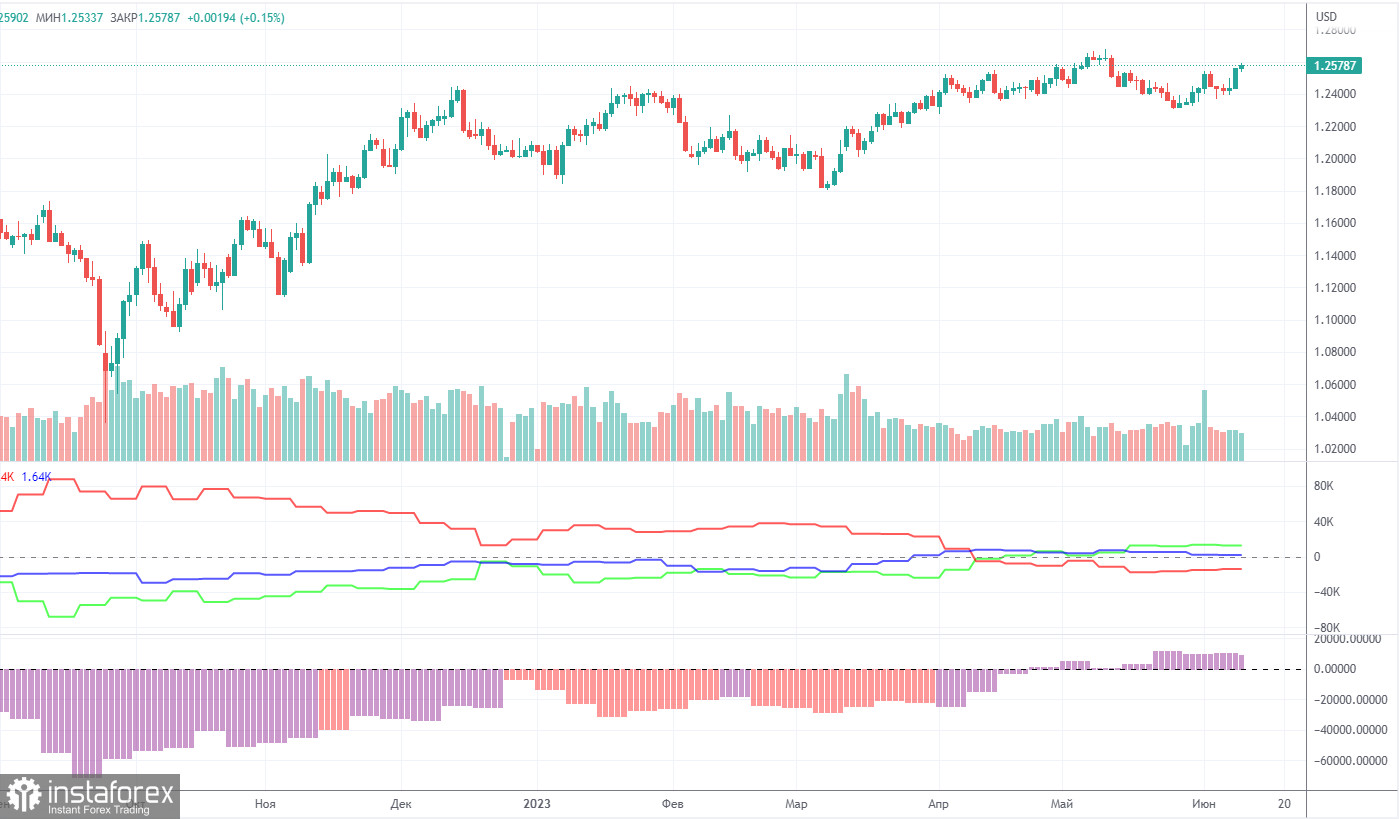
COT report:
According to the latest COT report, the "Non-commercial" group of traders closed 5,200 BUY contracts and closed 4,500 SELL contracts. Thus, the net position of non-commercial traders decreased by 700 contracts. Yet, it continues to grow. The net position has been steadily rising over the past 9-10 months but the mood of large speculators has remained bearish all this time. Now, we can say that the sentiment is bullish but only formally. The pound sterling has been growing against the US dollar for a long time (in the medium term), but it has had a few reasons for this in recent months. We believe that a long and protracted fall in the pound sterling is likely to start in the near future although COT reports indicate further strengthening of the British currency. However, traders keep increasing long positions. This is why it is hard to make a correct prediction.
The pound sterling has already climbed by a total of 2,300 points, which is a lot. Without a strong downward correction, the continuation of upward movement will be illogical. Besides, there are no drivers. The Non-commercial group of traders has now opened a total of 52,500 short contracts and 65,000 long contracts. I am skeptical about the long-term growth of the pound sterling and expect it to fall. However, market sentiment may be rather unpredictable.
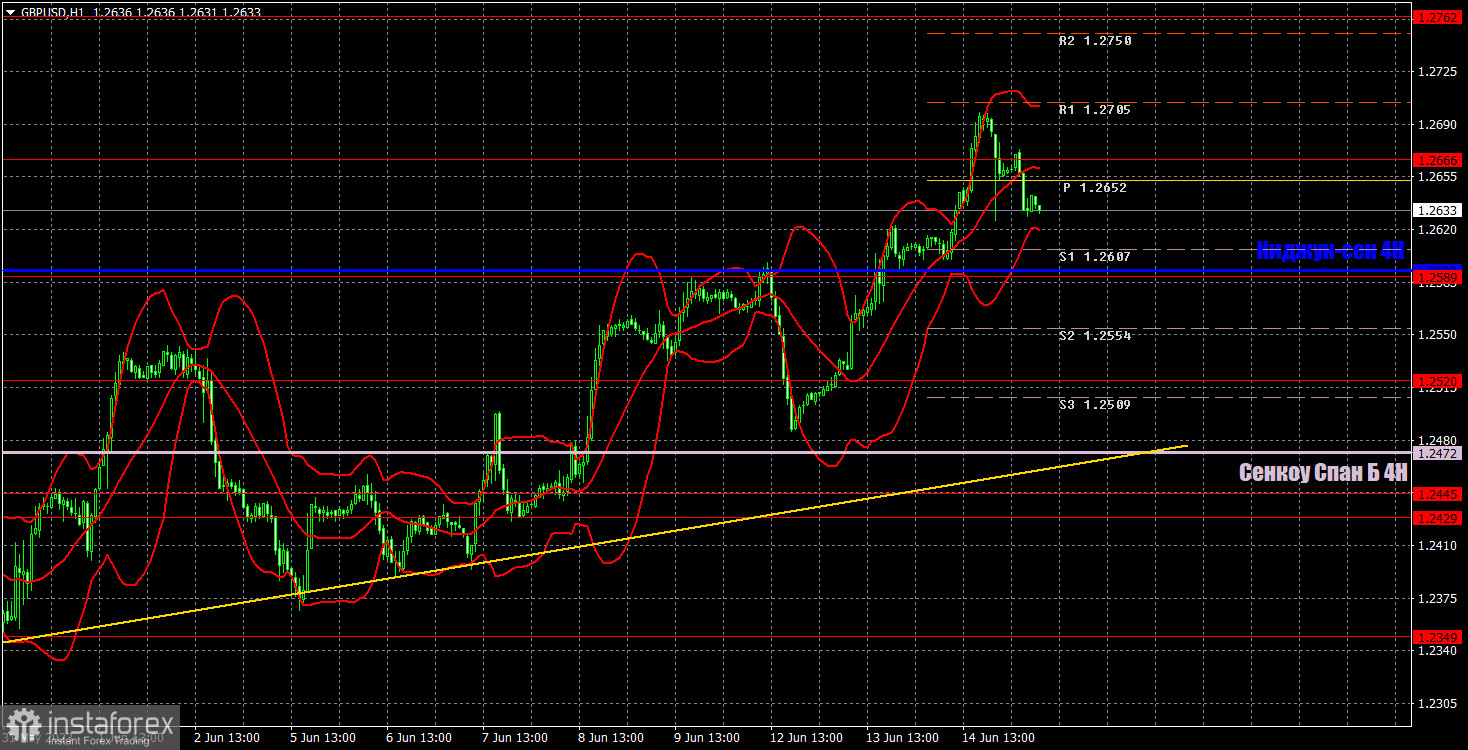
Analysis of GBP/USD 1H.
On the 1H chart, the pound/dollar pair maintains a bullish bias but with rebounds and pauses. The ascending trend line serves as a buy signal but I believe that further growth of the British currency is groundless. The pound sterling has been climbing for too long and downward corrections are short-lived. Judging by the technical indicators, we have an uptrend. Yet, it is hard to find the reasons which may push it higher. I suppose that a correction to the trend line is likely to begin in the near future.
On June 15, one should pay attention to the following levels: 1.2269, 1.2349, 1.2429-1.2445, 1.2520, 1.2589, 1.2666, 1.2762, 1.2863. Senkou Span B (1.2472) and Kijun-sen (1.2593) lines. The lines of the Ichimoku indicator can provide trading signals, e.g. bounces or breakouts from extreme levels and lines. Do not forget about placing a Stop Loss order at breakeven if the price moves in the right direction by 20 pips. The lines of the Ichimoku indicator can move during the day. Bear it in mind when determining trading signals. On the chart, there are support and resistance levels that can be used to lock in profits on transactions.
The economic calendar for the UK is empty today. The US will unveil several reports, e.g. industrial production, retail sales, and jobless claims data. However, investors are likely to pay zero attention to them. These reports may trigger volatility only if the figures are above or below forecast readings.
What's on charts:
Support and resistance levels (resistance /support) are thick red lines near which the trend may end. They do not provide trading signals.
The Kijun-sen and Senkou Span B lines are the lines of the Ichimoku indicator plotted to the H1 chart from the 4H one. They are strong lines.
Extreme levels are thin red lines from which the price bounced earlier. They provide trading signals.
Yellow lines are trend lines, trend channels, and any other technical patterns.
Indicator 1 on the COT charts is the net position size of each category of traders.
Indicator 2 on the COT charts is the net position size for the "Non-commercial" group of traders.