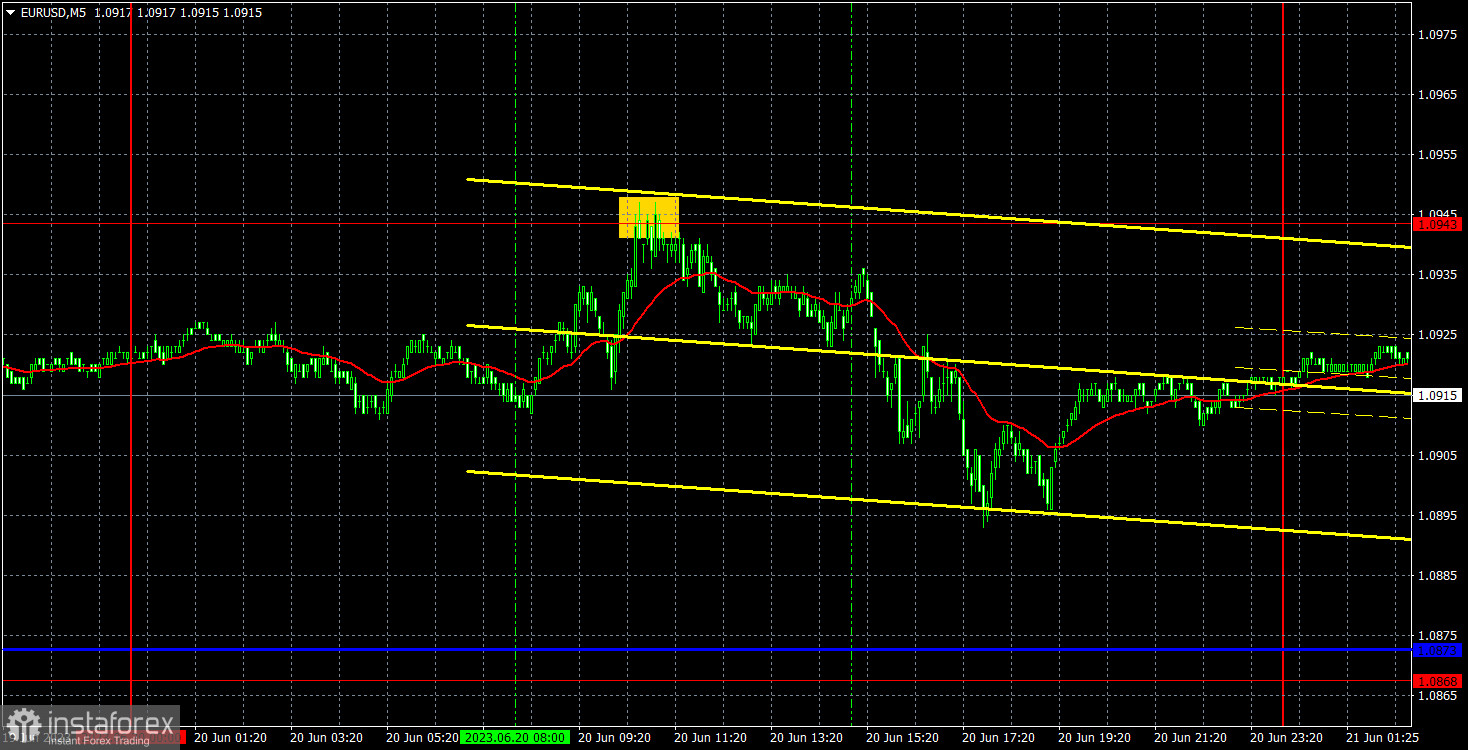
5M chart of EUR/USD
The EUR/USD pair has been going through low volatility and volume. The chart above may suggest that the pair moved quite actively, but in reality, there was only a 53-pip range between the day's high and low. Thus, we have witnessed the third consecutive boring and uninteresting day. Yesterday's only notable report was the number of approved construction permits in the United States. The report turned out slightly better than expected, which helped strengthen the dollar to some extent. But what kind of reaction are we talking about? A mere 20 pips, which is not interesting at all and does not affect the current technical picture. The pair continues to correct sluggishly downward against an empty calendar.
Yesterday, one signal was even formed. During the European trading session, the pair rebounded from the level of 1.0943 and then moved down by the aforementioned 50 pips. However, the price could not reach the target level by the end of the day, and no further signals were formed. Therefore, it was advisable to manually close the sell trade anywhere closer to the evening. It was possible to earn around 30 pips from it, which is not bad considering the current volatility.
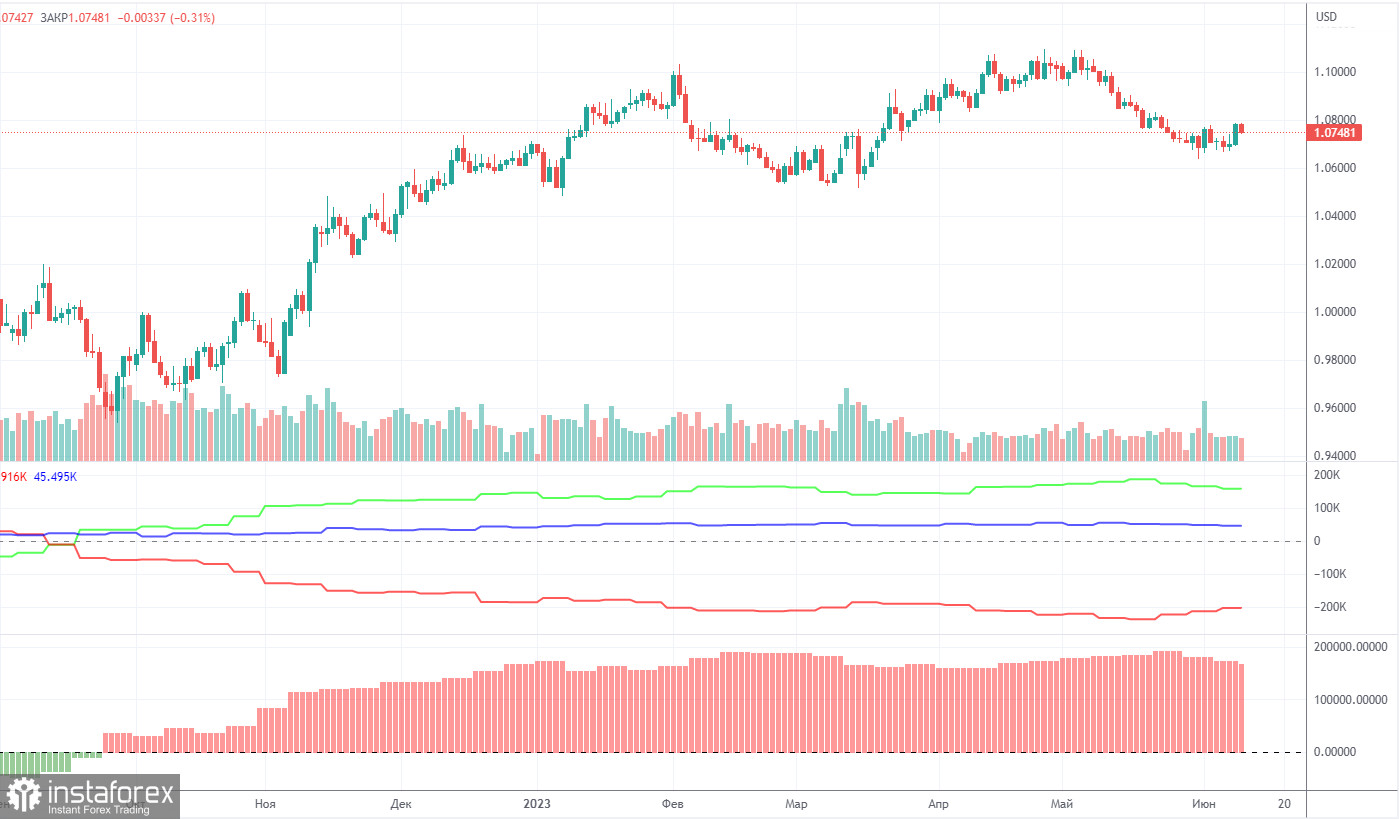
COT report:
On Friday, a new COT report for June 6 was released. In the last 9 months, COT reports have fully corresponded to what is happening on the market. The chart above clearly shows that the net position of big traders (the second indicator) began to grow again in September 2022. At the same time, the euro resumed an upward movement. The net position of non-commercial traders is bullish. The euro is trading at its highs against the US dollar.
I have already mentioned that a fairly high value of the "net position" indicates the end of the uptrend. The first indicator also signals such a possibility as the red and green lines are very far from each other. It often occurs before the end of the trend. The euro tried to start falling a few months ago but there was only a pullback. During the last reporting week, the number of long positions of the "Non-commercial" group of traders decreased by 5,700 and the number of short positions rose by 1,500. The number of long positions is higher than the number of short ones. This is a very large gap. The number of long positions is 59,000 higher than short ones. The difference is more than three times. The correction has begun. Yet, it may not be a correction but the start of a new downtrend. At this time, it is clear that the pair is likely to resume a downward movement without COT reports.
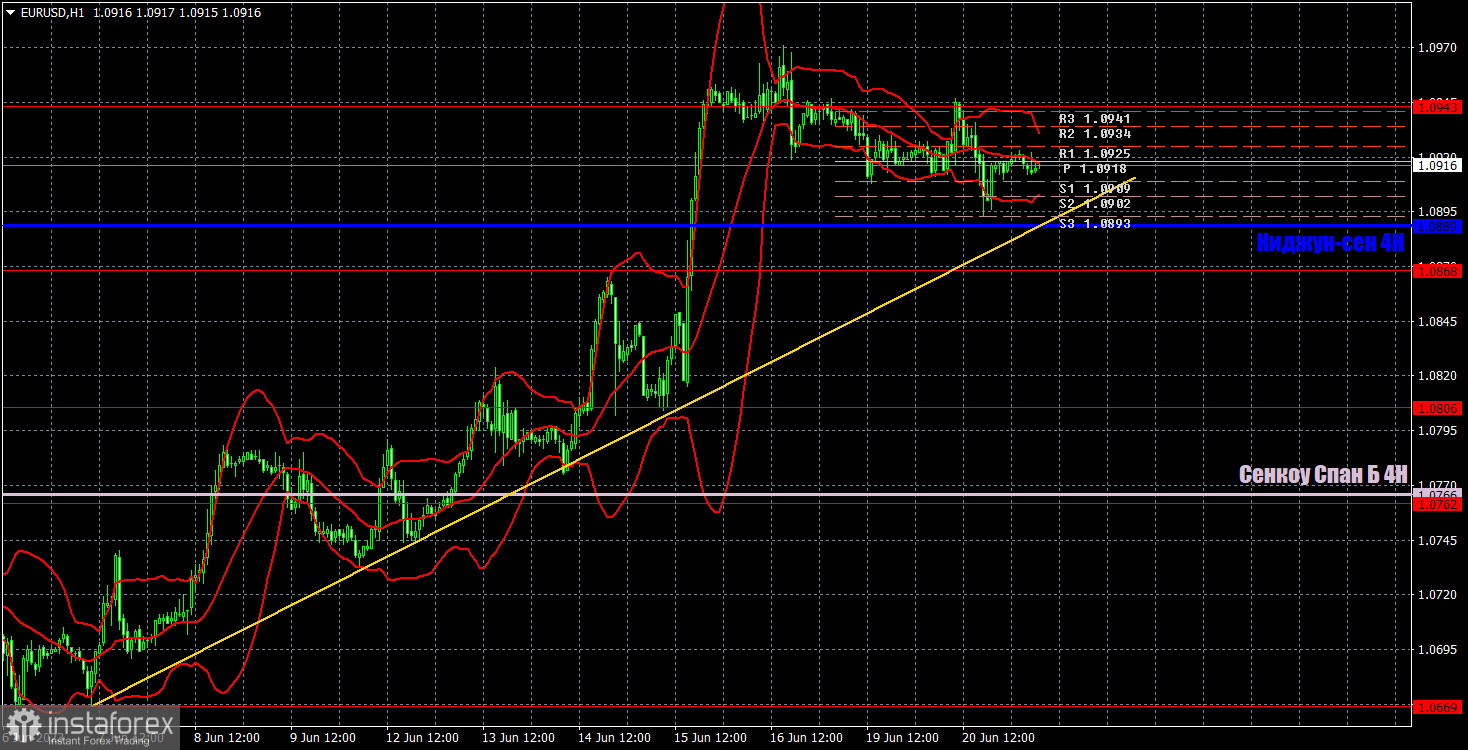
1H chart of EUR/USD
In the 1-hour chart, the pair is trying to start an uptrend but there are no drivers for growth. Last week, there were many events that bolstered its rise. However, in the medium term, there are still no reasons to go long. Technical indicators signal an uptrend. It would be better not to sell the pair now. We need to wait at least for consolidation below the trend line and the target level.
On June 21, trading levels are seen at 1.0581, 1.0658-1.0669, 1.0762, 1.0806, 1.0868, 1.0943, 1.1092, 1.1137, as well as the Senkou Span B line (1.0766) and the Kijun-sen line (1.0889) lines. Ichimoku indicator lines can move intraday, which should be taken into account when determining trading signals. There are also support and resistance although no signals are made near these levels. Signals could be made when the price either breaks or bounces from these extreme levels. Do not forget to place Stop Loss at the breakeven point when the price goes by 15 pips in the right direction. In case of a false breakout, it could save you from possible losses.
Several ECB and Fed officials are scheduled to deliver speeches today. However, traders are likely to ignore their statements. Federal Reserve Chairman Jerome Powell will deliver an important speech in Congress. The main focus is on that.
Indicators on charts:
Resistance/support - thick red lines, near which the trend may stop. They do not make trading signals.
Kijun-sen and Senkou Span B are the Ichimoku indicator lines moved to the hourly timeframe from the 4-hour timeframe. They are also strong lines.
Extreme levels are thin red lines, from which the price used to bounce earlier. They can produce trading signals.
Yellow lines are trend lines, trend channels, and other technical patterns.
Indicator 1 on the COT chart is the size of the net position of each trader category.
Indicator 2 on the COT chart is the size of the net position for the Non-commercial group of traders.