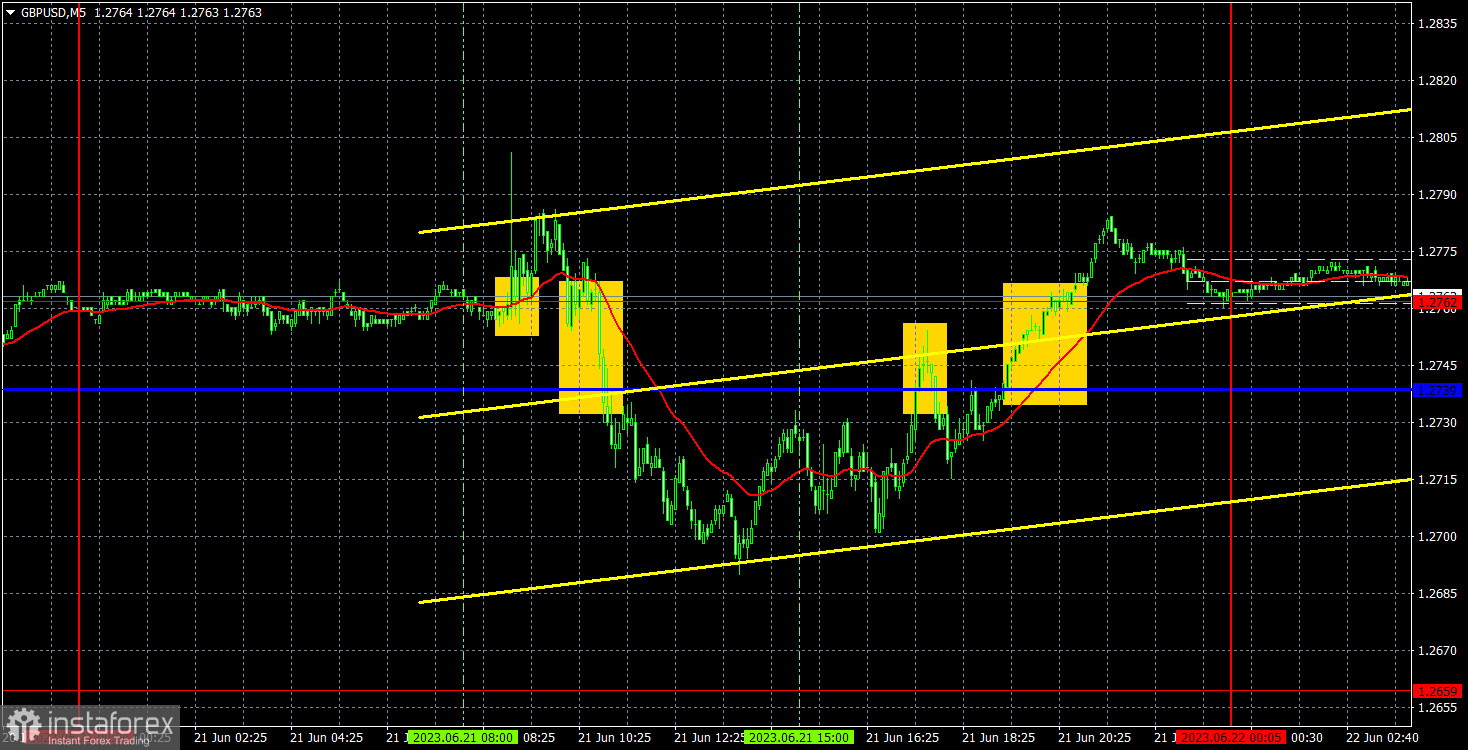
5M chart of GBP/USD
GBP/USD fluctuated in a volatile Wednesday session. The pair fell following the release of the UK inflation report. And then it managed to recover some ground during Federal Reserve Chairman Jerome Powell's speech. Interestingly, it would have been more logical for the pound to fall in the second half of the day and rise in the first half, as the absence of an inflation slowdown theoretically suggests that the Bank of England may raise interest rates further in the future. We don't believe in such a scenario, but the market is currently seizing any opportunity to buy the pound. However, it did not utilize this opportunity. Instead, Powell's speech during the US session caused dissatisfaction among traders, and the dollar came under selling pressure, despite the Fed chair saying that he expects more rate hikes ahead.
There were enough trading signals on Wednesday, but most of them should have been ignored. The first two signals formed during the European session, but they formed during the release of the inflation report, making it dangerous to trade them. You should have ignored the first signal, and you could have made an attempt on the second one, but the trade closed with a breakeven stop loss. Two more signals formed during the US session. The second signal should not have been traded as it appeared too late, and you could have had a go on the first signal but it appeared at a time when traders should have considered closing their trades. Moreover, there was a significant resistance area (1.2739-1.2762) above, and the stop loss for the trade would have had to be placed above it, with little time remaining.
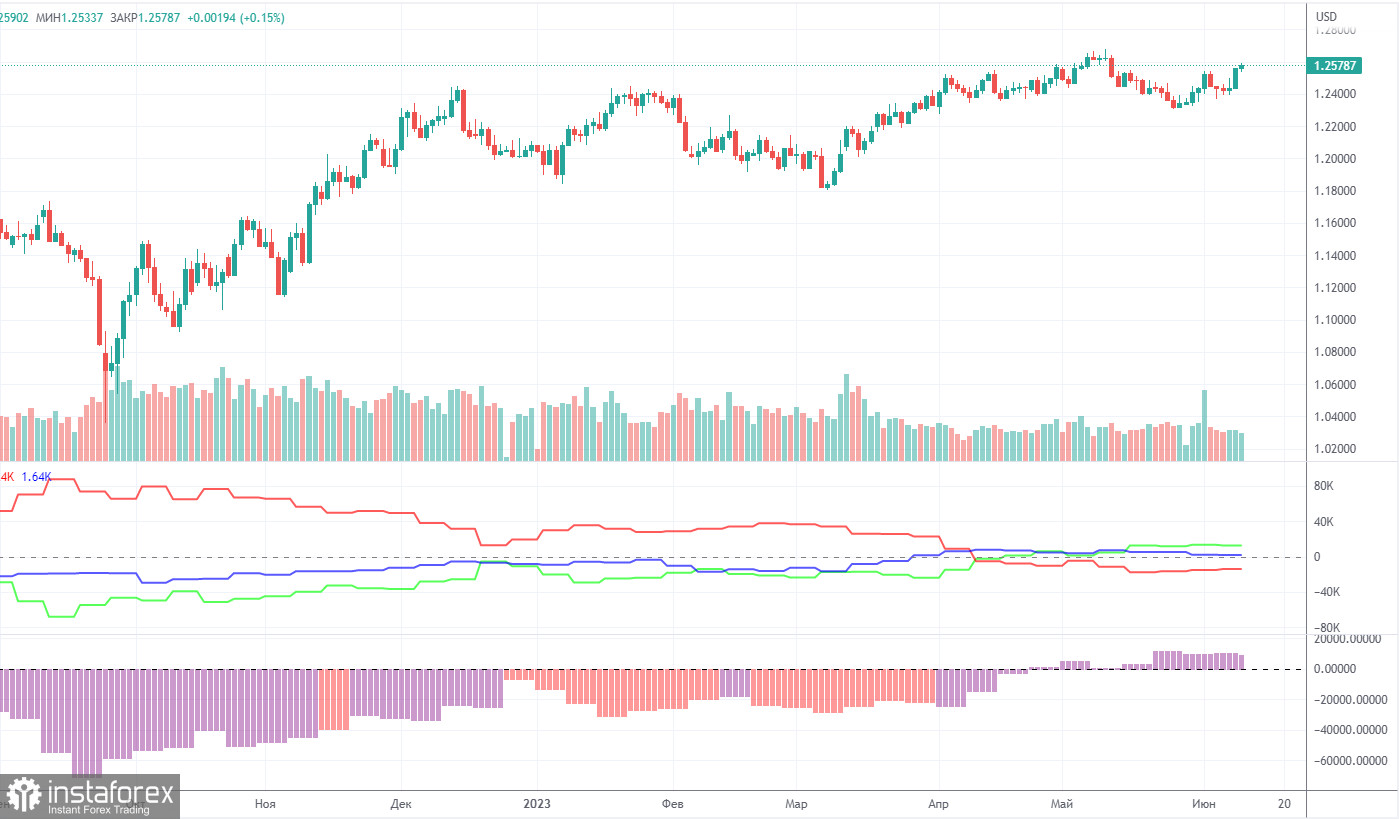
COT report:
According to the latest report, non-commercial traders closed 5,200 long positions and 4,500 short ones. The net position dropped by 700 but remained bullish. Over the past 9-10 months, the net position has been on the rise despite bearish sentiment. In fact, sentiment is now bullish, but it is a pure formality. The pound is bullish against the greenback in the medium term, but there have been hardly any reasons for that. We assume that a prolonged bear run may soon begin even though COT reports suggest a bullish continuation. However, we can hardly explain why the uptrend should go on.
The pound has gained about 2,300 pips. Therefore, a bearish correction is now needed. Otherwise, a bullish continuation would make no sense even despite the lack of support from fundamental factors. Overall, non-commercial traders hold 52,500 sell positions and 65,000 long ones. We do not see the pair extending growth in the long term.
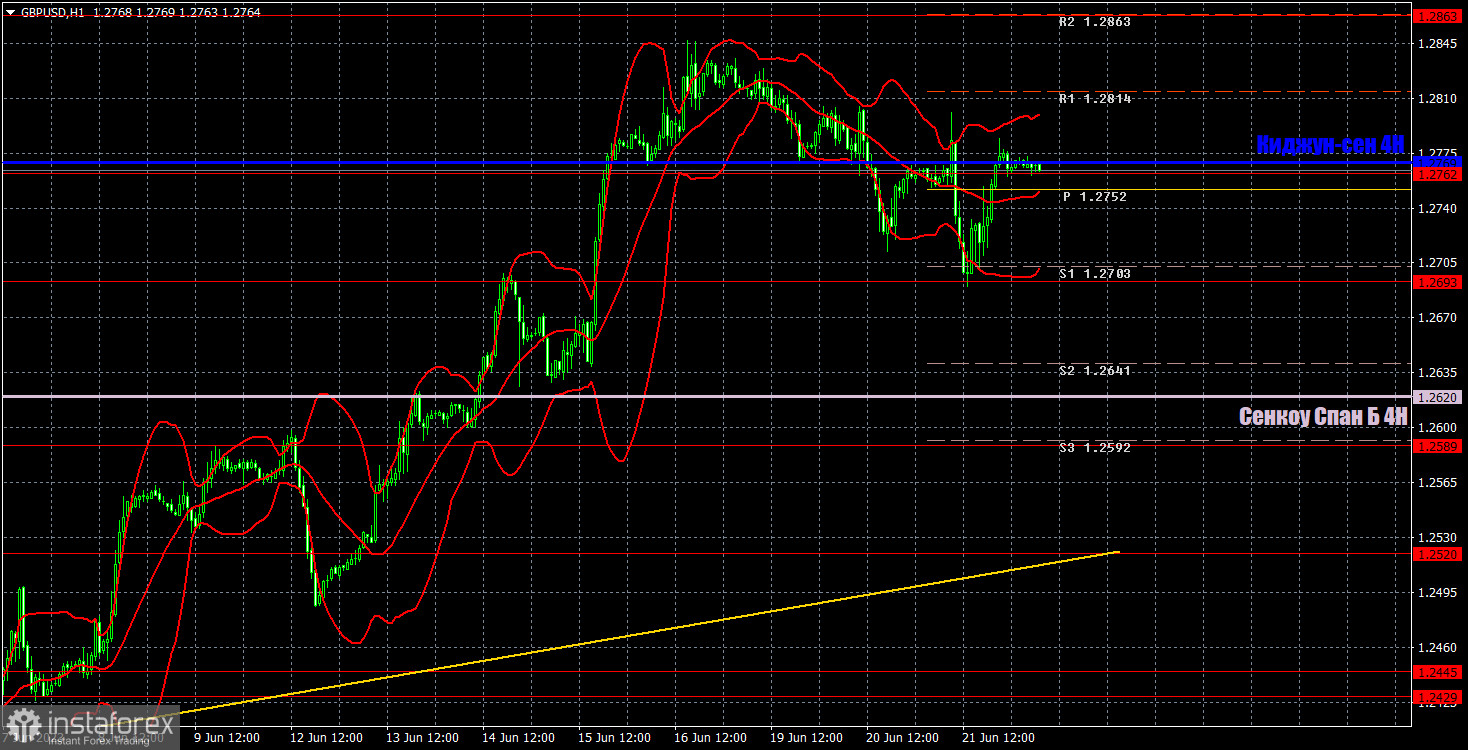
1H chart of GBP/USD
In the 1-hour chart, GBP/USD maintains a bullish bias, although it is correcting at the moment. The ascending trend line serves as a buy signal but I believe that further growth of the British currency is groundless. The pound sterling has been climbing for too long and downward corrections are short-lived (like in the last three days). Judging by the technical indicators, we have an uptrend. You should avoid selling the pair without proper signals. The market can sustain the trend even without a "fundamental" basis.
On June 22, trading levels are seen at 1.2349, 1.2429-1.2445, 1.2520, 1.2589, 1.2666, 1.2762, 1.2863, 1.2981-1.2987. The Senkou Span B line (1.2620) and the Kijun-sen line (1.2769) may also generate signals when the price either breaks or bounces off them. A Stop Loss should be placed at the breakeven point when the price goes 20 pips in the right direction. Ichimoku indicator lines can move intraday, which should be taken into account when determining trading signals. There are also support and resistance which can be used for locking in profits.
On Thursday, the Bank of England will hold its meeting, and Fed Chairman Jerome Powell will give his second speech in Congress. As we can see, there are enough important events today, which means that the pair may trade in a confusing and volatile manner once again.
Indicators on charts:
Resistance/support - thick red lines, near which the trend may stop. They do not make trading signals.
The Kijun-sen and Senkou Span B lines are the Ichimoku indicator lines moved to the hourly timeframe from the 4-hour timeframe. They are also strong lines.
Extreme levels are thin red lines, from which the price used to bounce earlier. They can produce trading signals.
Yellow lines are trend lines, trend channels, and other technical patterns.
Indicator 1 on the COT chart is the size of the net position of each trader category.
Indicator 2 on the COT chart is the size of the net position for the Non-commercial group of traders.