empty
27.07.2023 08:25 AM
Outlook for EUR/USD on July 27. COT report. The dollar fell despite positive news

Analysis of EUR/USD 5M

This image is no longer relevant

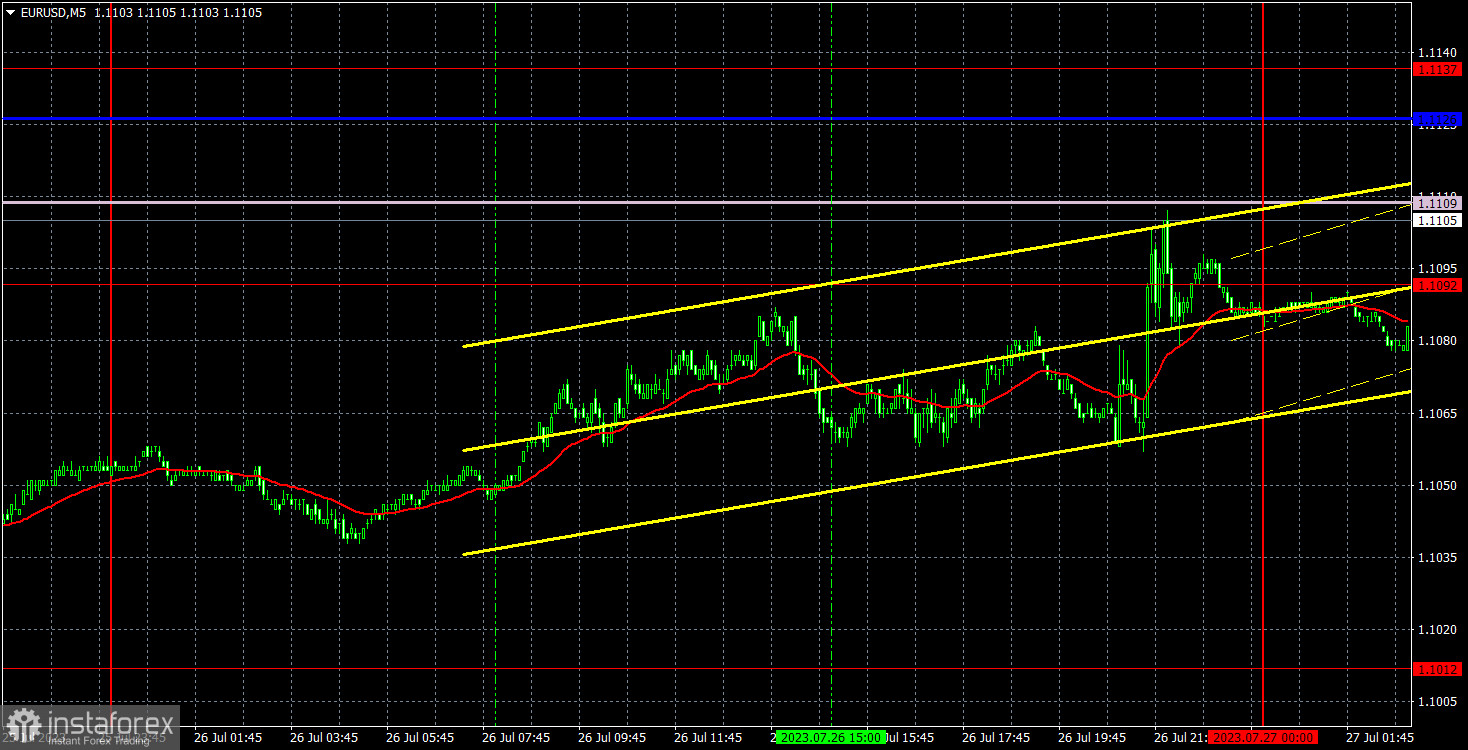
The EUR/USD pair gradually rose on Wednesday. It went through low volatility for most of the day, clearly waiting for Federal Reserve Chair Jerome Powell's evening speech. As expected, the rate was raised by 0.25%, and Powell mentioned that there is no clear plan for interest rates. He leaves the door open to another rate hike in September. Everything will depend on incoming macroeconomic data. Two inflation reports and two labor market reports will be released before the next meeting, providing enough data for analysis and decision-making. We believe that Powell's stance was somewhat hawkish, but this did not support the dollar. This is another situation where the US dollar fell when it could have shown growth.

There were no significant entry points on Wednesday. The first signal formed late in the evening after Powell's speech, and it was not advisable to act on it. This is in the absence of influential economic releases throughout the day. And as a result, there were no trading signals. Now, it is important to observe the market's reaction to the European Central Bank meeting, which concludes today.

COT report:

This image is no longer relevant

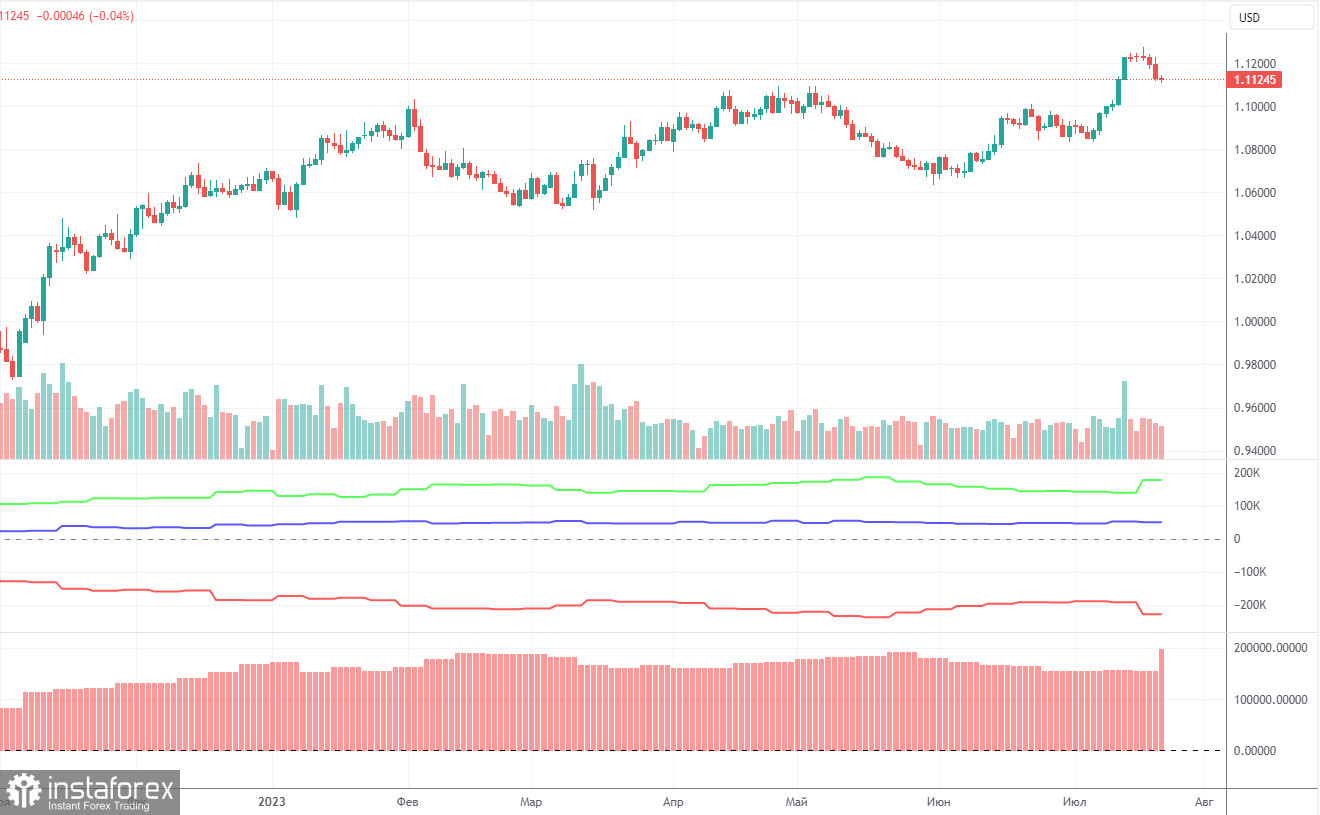
On Friday, a new COT report for July 18 was released. In the last 10 months, COT reports fully corresponded to what is happening in the market. The chart above clearly shows that the net position of major traders (the second indicator) began to grow in September 2022 and at about the same time the euro started climbing too. In the last 5-6 months, the net position has not risen but the euro remains at very high levels. At the moment, the net position of non-commercial traders is bullish. The euro keeps climbing against the US dollar.

I have already mentioned the fact that a fairly high value of the net position signals the end of an uptrend. This is also confirmed by the first indicator where the red and green lines are very far from each other. Usually, it precedes the end of the trend. During the last reporting week, the number of long positions of the non-commercial group of traders increased by 40,100 and the number of short ones by 1,500. The net position increased by 38,600 contracts. The number of long positions is higher than the number of short ones of non-commercial traders by 179,000. This is a very large gap as the difference is almost threefold. Even without COT reports, it is obvious that the euro should decline but speculators are still in no hurry to sell, and there are no signals for a reversal yet.

Analysis of EUR/USD 1H

This image is no longer relevant

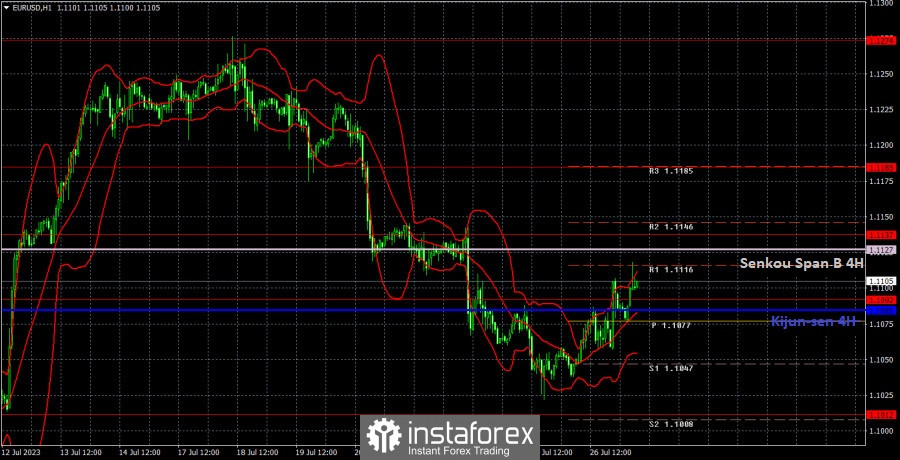
On the 1H chart, the euro/dollar pair started a new upward movement, which could be a correction against the previous correction. As long as the price remains below the Senkou Span B line, the current uptrend should be considered a pullback. Especially since Powell's rhetoric was quite hawkish. However, if the market has started to mindlessly buy the euro again, then there's nothing we can do about it. We need to prepare for a potential new annual high.

On July 27, traders should pay attention to the following key levels: 1.0806, 1.0868, 1.0943, 1.1012, 1.1092, 1.1137, 1.1185, 1.1274, 1.1321, 1.1391, as well as the Senkou Span B line (1.1127) and the Kijun-sen line (1.1085). The lines of the Ichimoku indicator can move during the day, which should be taken into account when determining trading signals. There are support and resistance levels that can be used to lock in profits. Traders look for signals at rebounds and breakouts. It is recommended to set the Stop Loss orders at the breakeven level when the price moves in the right direction by 15 pips. This will protect against possible losses if the signal turns out to be false.

Today, the ECB will announce its crucial interest rate decision, and there is no doubt that it will also increase by 0.25%. More importantly, we should focus on ECB President Christine Lagarde's speech after the meeting. However, there are also other important events to pay attention to, such as US reports on GDP for the second quarter and orders for durable goods, which can also influence the pair's movement.

Description of the chart:

Support and resistance levels are thick red lines near which the trend may end. They do not provide trading signals;

The Kijun-sen and Senkou Span B lines are the lines of the Ichimoku indicator, plotted to the 1H timeframe from the 4H one. They provide trading signals;

Extreme levels are thin red lines from which the price bounced earlier. They provide trading signals;

Yellow lines are trend lines, trend channels, and any other technical patterns;

Indicator 1 on the COT charts is the net position size for each category of traders;

Indicator 2 on the COT charts is the net position size for the Non-commercial group.

Paolo Greco,
Especialista em análise na InstaForex
© 2007-2025
Selecionar intervalo de tempo
5
min
15
min
30
min
1
hora
4
horas
1
dia
1
s.
Ganhe com as variações das taxas das criptomoedas com a InstaForex.
Baixe o MetaTrader 4 e abra a sua primeira operação.
  • Grand Choice
    Contest by
    InstaForex
    InstaForex always strives to help you
    fulfill your biggest dreams.
    PARTICIPE DO CONCURSO

Recommended Stories

Recomendações de negociação e análise para o GBP/USD em 20 de março: Reunião do Banco da Inglaterra em breve

O par GBP/USD continuou sendo negociado dentro da mesma faixa na quarta-feira. Apesar da reunião do Fed, do discurso de Jerome Powell e da atualização do dot-plot, o mercado

Paolo Greco 16:47 2025-03-20 UTC+2

EUR/USD: Plano de Negociação para a Sessão dos E.U.A. de 14 de março (Revisão das Negociações da Manhã)

Na minha previsão da manhã, foquei no nível 1,0852 e planejei basear minhas decisões de negociação nele. Vamos examinar o gráfico de 5 minutos para ver o que aconteceu

Miroslaw Bawulski 21:10 2025-03-14 UTC+2

GBP/USD: Plano de Negociação para a Sessão dos E.U. de 11 de março (Análise das Negociações da Manhã). Compradores de Libra buscam uma nova máxima semanal

Na minha previsão da manhã, concentrei-me no nível 1,2876 e planejei tomar decisões de negociação com base nele. Vamos dar uma olhada no gráfico de 5 minutos e analisar

Miroslaw Bawulski 20:53 2025-03-11 UTC+2

EUR/USD: Plano de Negociação para a Sessão dos E.U. de 11 de março (Revisão das Negociações da Manhã). O euro continuou a subir e atualizou sua alta semanal

Na minha previsão da manhã, foquei no nível de 1,0886 e planejei tomar decisões de negociação com base nele. Vamos dar uma olhada no gráfico de 5 minutos e analisar

Miroslaw Bawulski 20:43 2025-03-11 UTC+2

Como negociar o GBP/USD em 7 de março? Dicas simples e análise de negociação para iniciantes

O par GBP/USD também se estabilizou na quinta-feira. Não houve razões fundamentais ou macroeconômicas que justificassem a alta ou queda da libra esterlina ou do dólar americano

Paolo Greco 16:17 2025-03-07 UTC+2

GBP/USD: Plano de Negociação para a Sessão dos E.U.A de 18 de fevereiro (Revisão das Negociações da Manhã)

Em minha previsão matinal, foquei no nível 1,2627 como um ponto-chave para as decisões de entrada no mercado. Olhando para o gráfico de 5 minutos, o par se moveu mais

Miroslaw Bawulski 16:52 2025-02-18 UTC+2

GBP/USD: Plano de negociação para a sessão dos E.U.A. de 14 de fevereiro (revisão da negociação da manhã)

Na minha previsão da manhã, foquei no nível 1,2568 e planejei tomar decisões de negociação com base nele. Vamos dar uma olhada no gráfico de 5 minutos e analisar

Miroslaw Bawulski 22:05 2025-02-14 UTC+2

GBP/USD: Plano de negociação para a sessão dos E.U.A. de 13 de fevereiro (análise das negociações da manhã)

Na minha previsão da manhã, me concentrei no nível 1,2505 e planejei tomar decisões de negociação com base nele. Vamos examinar o gráfico de 5 minutos para

Miroslaw Bawulski 21:41 2025-02-13 UTC+2

EUR/USD: Plano de negociação para a sessão dos E.U.A. de 13 de fevereiro (análise das negociações da manhã)

Na minha previsão da manhã, concentrei-me no nível 1,0440 e planejei tomar decisões de negociação com base nele. Vamos examinar o gráfico de 5 minutos para ver o que aconteceu

Miroslaw Bawulski 20:03 2025-02-13 UTC+2

Recomendações e análise de negociação para o GBP/USD em 10 de fevereiro

O par GBP/USD voltou a se recuperar a partir de sua linha de tendência ascendente na sexta-feira, sugerindo uma possível continuação da tendência de alta. Na segunda-feira, o par sofreu

Paolo Greco 16:51 2025-02-10 UTC+2
Não pode falar agora?
Faça sua pergunta no chat.
Widget callback
 

Dear visitor,

Your IP address shows that you are currently located in the USA. If you are a resident of the United States, you are prohibited from using the services of InstaFintech Group including online trading, online transfers, deposit/withdrawal of funds, etc.

If you think you are seeing this message by mistake and your location is not the US, kindly proceed to the website. Otherwise, you must leave the website in order to comply with government restrictions.

Why does your IP address show your location as the USA?

  • - you are using a VPN provided by a hosting company based in the United States;
  • - your IP does not have proper WHOIS records;
  • - an error occurred in the WHOIS geolocation database.

Please confirm whether you are a US resident or not by clicking the relevant button below. If you choose the wrong option, being a US resident, you will not be able to open an account with InstaForex anyway.

We are sorry for any inconvenience caused by this message.