Analysis of GBP/USD 5M:
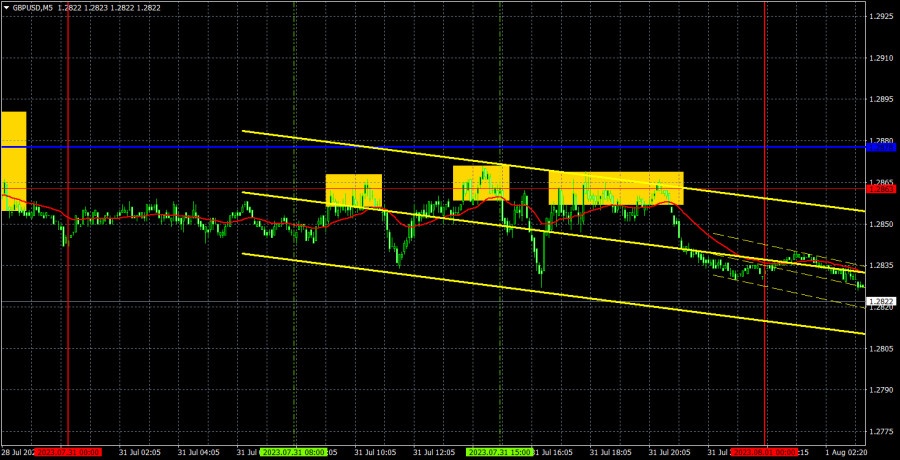
The GBP/USD currency pair remained flat during the week's first trading day. The volatility was just over 40 points, making trading the pair inconvenient and practically meaningless. It's important to note that there was no macroeconomic data or fundamental background for the pound and the dollar yesterday. As a result, traders had nothing to react to throughout the day. Mondays often experience flat market conditions. However, this week, traders will have access to more significant information, so we can anticipate serious movements. We can confirm that the downward trend continues, and the price remains below all the Ichimoku indicator lines.
As for trading signals, three or four were identified. In each case, the price rebounded from 1.2863, giving traders opportunities to open short positions. The price dropped by around 20 points in most cases, so all trades should have had a breakeven Stop Loss. Consequently, there were neither profits nor losses, and the last sell signal should not have been executed as it formed late in the evening. As a result, Monday passed with very uneventful movements and trading. However, things should become much more interesting in the upcoming period.
COT Report:
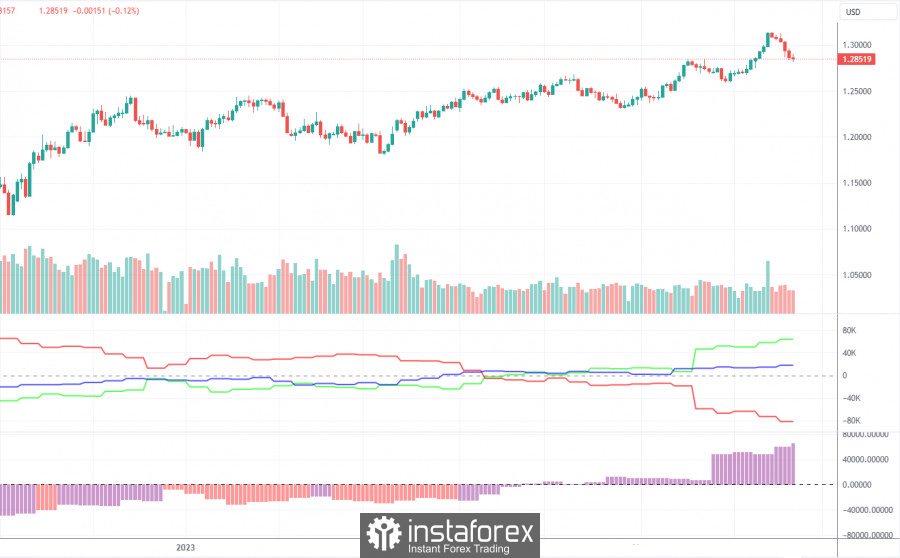
Based on the latest report for the British pound, the "Non-commercial" group closed 29.8 thousand contracts in buy positions and 25.0 thousand contracts in sell positions. As a result, the net position of non-commercial traders decreased by 4.8 thousand contracts over the week but continues to grow overall. The net position indicator has steadily risen for the past ten months, and the British pound has followed suit. However, the net position has increased too much to expect the pair's upward trend to continue. An extended and sustained decline in the pound is about to begin. The COT reports allow for slightly further strengthening of the British currency, but believing in it becomes increasingly difficult daily. Determining the underlying reasons driving the market to continue buying is challenging. Moreover, there are currently few technical sell signals.
The British currency has risen by 2800 points from its absolute lows reached last year, which is quite significant. However, with a strong downward correction, the continuation of the rise would be entirely logical. Nevertheless, logic has long been absent from the pair's movements. The market one-sidedly perceives the fundamental background, disregarding all data favoring the dollar. The "Non-commercial" group currently holds 105.5 thousand contracts in buy positions and 46.5 thousand in sell positions. We remain skeptical about the long-term growth of the British currency, but the market continues to buy, and the pair continues to rise.
Analysis of GBP/USD 1H:
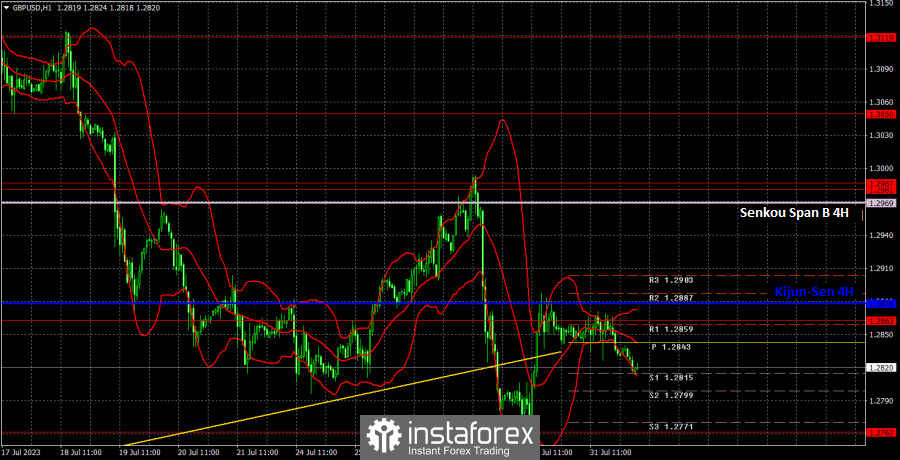
On the hourly timeframe, the GBP/USD pair corrected towards the critical line, and the rebound from this line initiated a new phase of downward movement, which had just begun. Numerous important events are expected this week, and the reaction to them is unpredictable. Therefore, the pound could easily demonstrate both growth and decline. However, the pair's decline should continue, given that the ascending trendline has been surpassed and the pound remains excessively overbought.
For August 1st, we identify the following significant levels: 1.2598-1.2605, 1.2693, 1.2762, 1.2863, 1.2981-1.2987, 1.3050, 1.3119, 1.3175, 1.3222, and 1.3273. The Senkou Span B (1.2969) and Kijun-sen (1.2878) lines can also serve as sources of trading signals. Signals may arise from "bounces" and "breakthroughs" of these levels and lines. Setting the stop-loss level to breakeven when the price moves in the correct direction by 20 points is recommended. Also, remember that the Ichimoku indicator lines may shift during the day, which should be considered when determining trading signals. Furthermore, the illustration includes support and resistance levels that can be used for profit-taking on trades.
On Tuesday, the UK will release only the July manufacturing sector's business activity index in the second estimate. It is not expected to cause any significant reactions. In the US, there will be more critical reports, such as the ISM manufacturing index and the JOLTs report on the number of job openings. American publications can trigger strong movements, especially if the values significantly deviate from the forecast.
Explanations for the illustrations:
Price support and resistance levels - thick red lines around which movement may end. They are not sources of trading signals.
Kijun-sen and Senkou Span B lines - lines of the Ichimoku indicator transferred from the 4-hour timeframe to the hourly timeframe. They are strong lines.
Extreme levels - thin red lines from which the price previously bounced. They are sources of trading signals.
Yellow lines - trend lines, channels, and other technical patterns.
Indicator 1 on the COT charts - the size of the net position for each trader category.
Indicator 2 on the COT charts - the size of the net position for the "Non-commercial" group.


