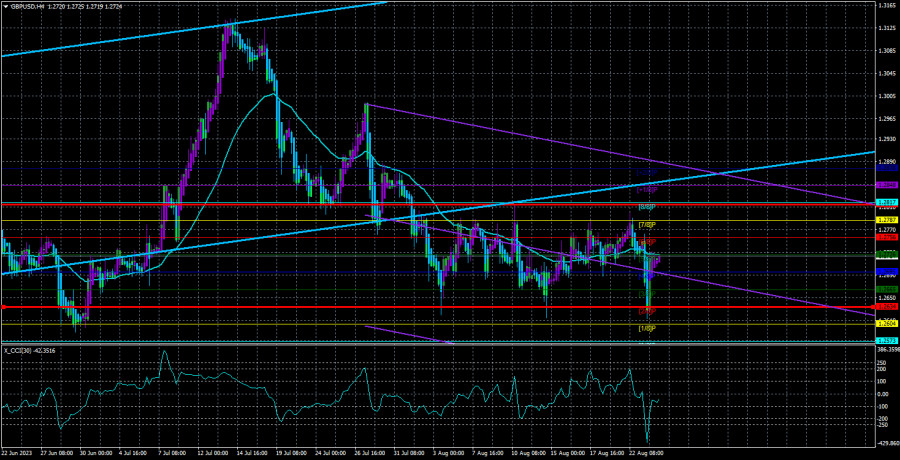
The GBP/USD currency pair fell by almost 150 points yesterday following the release of business activity indices in the services and manufacturing sectors of the European Union and the United Kingdom. While only the European indices affected the euro, the pound was influenced by both the European and British indices. This explains the pound's more significant drop, which offset all its losses by the end of the day. Now, if you look closely at the illustration above, you'll see that despite the sharp decline on Wednesday, the pair still sits within the lateral channel of 1.2634–1.2787. Yesterday, it touched the lower boundary of this channel for the third time, predictably rebounding from it, and now it may rise back to the 1.2787 level. Notably, this movement doesn't necessarily require any specific fundamental or macroeconomic background - the pair is in a flat trend, which means the movements are random.
Thus, the technical outlook remains unchanged from the previous day despite the high volatility. However, one thing does concern us. The CCI indicator entered oversold territory yesterday, dropping quite deep. Such signals are typically strong. Although the pair might rise to the mentioned level of 1.2787, it won't remain flat forever, and the chances of a more significant upward movement are slightly higher than yesterday.
On the 24-hour time frame, there's no change. The pair still hasn't settled below the Ichimoku cloud, so the upward trend remains intact, and an upward move could resume anytime. As on many previous occasions, the pound may see a minor pullback. Even though we see no reason for the British currency to continue its rise, we must admit that there are still no strong signals indicating a trend change in the long term.
The August UK manufacturing business activity index dropped from 45.3 points to 42.5. The corresponding index for the services sector fell from 51.5 points to 48.7. Consequently, all business activity indices are now below the "waterline" – the 50.0 mark. Hence, we can anticipate further deterioration in other macroeconomic indicators and expect the Bank of England to take a pause. As we've repeatedly stated, the position of the British regulator is unenviable. Inflation remains very high, economic indicators continue to decline, and rates are rising. However, they can't rise indefinitely. The market seems to interpret the macroeconomic backdrop very one-sidedly, seemingly believing in the perpetual tightening of monetary policy in the British Isles. In our opinion, this is a mistake, but as they say, one cannot argue with the market.
This week, there are virtually no significant events left. Today, a more or less important report on orders for durable goods in the US will be released, and tomorrow, Jerome Powell will speak. In essence, there's only one question regarding the head of the Federal Reserve, and we won't get an answer. After inflation in the States accelerated for the first time in 14 months, the rate will be raised in September. However, speaking confidently about it without the August inflation report doesn't make sense.
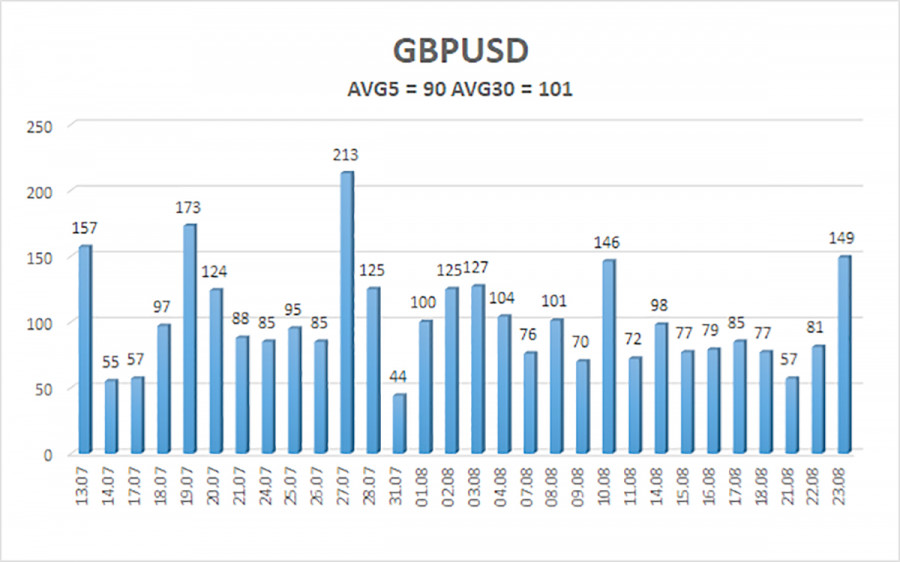
The average volatility of the GBP/USD pair for the last five trading days is 90 points. For the pound/dollar pair, this value is considered "average." Thus, on Thursday, August 24, we expect movement within the range limited by levels 1.2634 and 1.2814. A reversal of the Heiken Ashi indicator upwards will signal a new upturn in the lateral channel.
Nearest support levels:
S1 – 1.2695
S2 – 1.2634
S3 – 1.2604
Nearest resistance levels:
R1 – 1.2726
R2 – 1.2756
R3 – 1.2787
Trading recommendations:
The GBP/USD pair in the 4-hour timeframe remains above the moving average, but overall the trend is flat. It is possible to trade now on a rebound from the upper (1.2787) or lower (1.2634) boundaries of the lateral channel, but reversals may occur before reaching them. The moving average can be crossed frequently, which doesn't signify a trend change.
Illustrations explanations:
Linear regression channels – help determine the current trend. The trend is currently strong if both are pointed in the same direction.
Moving average line (settings 20.0, smoothed) – determines the short-term tendency and the direction in which trading should be conducted.
Murray levels – target levels for movements and corrections.
Volatility levels (red lines) – the likely price channel the pair will spend the next day, based on current volatility indicators.
CCI indicator – its entry into the oversold area (below -250) or the overbought area (above +250) means that a trend reversal in the opposite direction is approaching.


