empty
13.09.2023 11:40 AM
EUR/USD and GBP/USD: Technical analysis for September 13

EUR/USD

This image is no longer relevant

Higher Timeframes

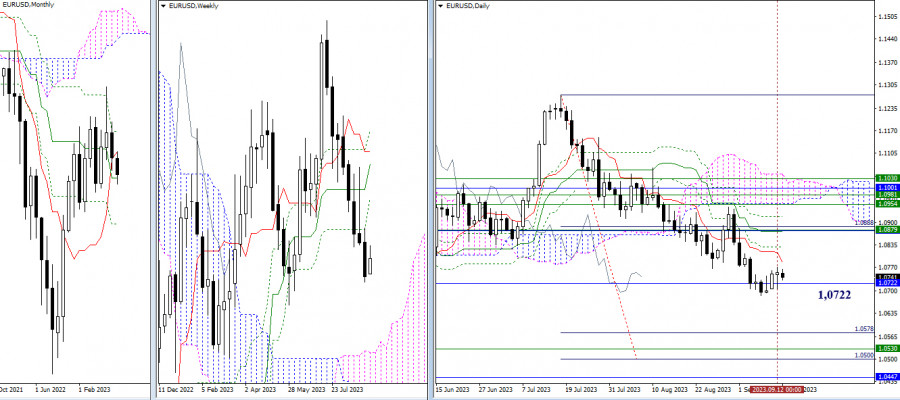
The attraction and influence of the monthly medium-term trend (1.0722) continue to impact the current situation. The upward correction is moving slowly but still towards its first target level—the daily short-term trend, which has now descended to 1.0785. If the bulls manage to seize control of the daily Tenkan, then the most significant area will be at 1.0875–79 (daily medium-term trend + monthly short-term trend + weekly Fibonacci Kijun), with interim resistance possibly at 1.0830 (daily Fibonacci Kijun). For the bears, their main task remains the same—to overcome the attraction at 1.0722 and firmly establish themselves below the correction low (1.0687).

This image is no longer relevant

H4 - H1

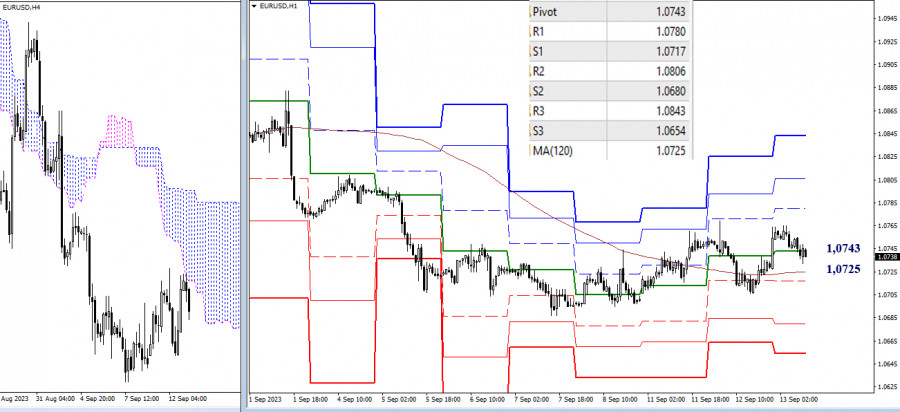
On the lower timeframes, the bulls are currently maintaining the advantage, continuing to work above key levels, which are now located at the 1.0725 - 1.0743 range (weekly long-term trend + central pivot point). The development of the upward movement will lead to the testing of intraday resistance levels of classic pivot points (1.0780 - 1.0806 - 1.0843). When priorities shift, attention will focus on support levels of classic pivot points (1.0717 - 1.0680 - 1.0654).

***

GBP/USD

This image is no longer relevant

Higher Timeframes

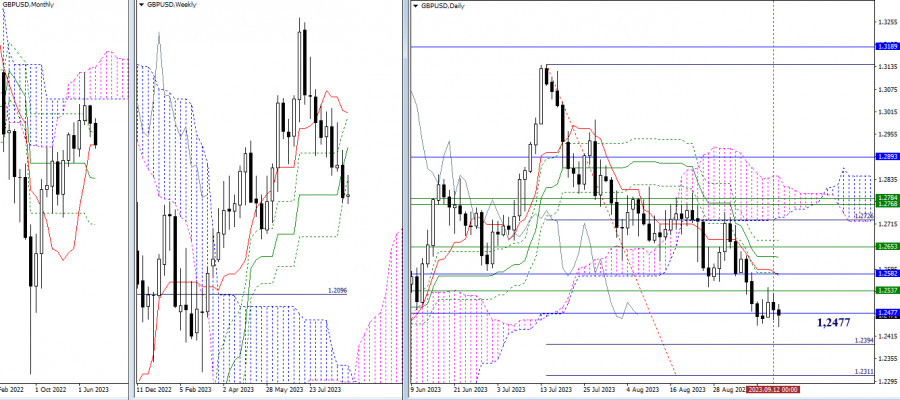
The attraction of the monthly short-term trend (1.2477) is holding back the situation's development, resulting in consolidation with a slight corrective rise. At the same time, strong resistances from different timeframes are guarding this correction stage at 1.2537 (weekly Fibonacci Kijun) - 1.2582–89 (monthly Fibonacci Kijun + daily short-term trend). If the bears manage to break free from the influence of the monthly Tenkan (1.2477), their reward could be achieving the target of breaking the daily Ichimoku cloud (1.2311 - 1.2394).

This image is no longer relevant

H4 - H1

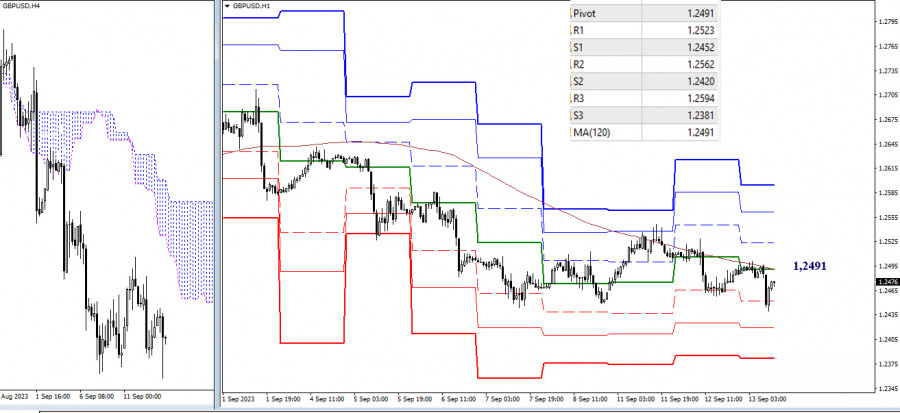
Over the past few days, the weekly long-term trend has withstood all the attacks and pressure from the bullish side, defending the bearish dominance in the situation. Today, the weekly long-term trend has joined forces with the central pivot point of the day at 1.2491. A break above could change the current balance of power in favor of the bulls, and intraday targets for further ascent will be at 1.2523 - 1.2562 - 1.2594 (resistances of classic pivot points). Failure by the bulls and the opponent's activity could lead to further strengthening of bearish sentiment, with subsequent reference points for decline in this case noted at 1.2420 - 1.2381 (supports of classic pivot points).

***

The technical analysis of the situation uses:

Higher timeframes - Ichimoku Kinko Hyo (9.26.52) + Fibo Kijun levels

Lower timeframes - H1 - Pivot Points (classic) + Moving Average 120 (weekly long-term trend)

Evangelos Poulakis,
Especialista em análise na InstaForex
© 2007-2025
Summary
Urgency
Analytic
Zhizhko Nadezhda
Start trade
Ganhe com as variações das taxas das criptomoedas com a InstaForex.
Baixe o MetaTrader 4 e abra a sua primeira operação.
  • Grand Choice
    Contest by
    InstaForex
    InstaForex always strives to help you
    fulfill your biggest dreams.
    PARTICIPE DO CONCURSO

Recommended Stories

GBP/USD: Análise do indicador em 4 de setembro de 2025

Na quarta-feira, o par moveu-se para baixo até o nível de 61,8% – 1,3313 (linha pontilhada amarela), depois reverteu para cima, fechando a vela diária em 1,3440. Hoje, ele pode

Stefan Doll 16:45 2025-09-04 UTC+2

EUR/USD:Análise do indicador em 4 de setembro de 2025

Na quarta-feira, o par moveu-se para baixo até o nível de 38,2% em 1,1608 (linha pontilhada azul), depois reverteu para cima, fechando a vela diária em 1,1660. Hoje, ele pode

Stefan Doll 16:41 2025-09-04 UTC+2

Previsão para o GBP/USD em 4 de setembro de 2025

No gráfico horário, o GBP/USD na quarta-feira se recuperou da zona de suporte de 1,3357–1,3364, reverteu a favor da libra esterlina e se consolidou acima da zona de 1,3416–1,3425. Assim

Samir Klishi 15:37 2025-09-04 UTC+2

Previsão para o AUD/USD para 4 de setembro de 2025

AUD/USD Pelo terceiro dia consecutivo, o dólar australiano vem testando a linha MACD pelas sombras superiores das velas diárias. A linha de sinal do oscilador Marlin está cada vez mais

Laurie Bailey 15:30 2025-09-04 UTC+2

Previsão para o EUR/USD para 4 de setembro de 2025

EUR/USD Na quarta-feira, o euro avançou 20 pontos, adiando a consolidação abaixo do nível 1,1632 para um momento um pouco mais adiante. É possível que a vela de hoje feche

Laurie Bailey 15:12 2025-09-04 UTC+2

Previsão para o GBP/USD em 4 de setembro de 2025

GBP/USD Ao atingir o nível de suporte de 1,3364 pela segunda vez com as sombras inferiores das velas diárias na terça e na quarta-feira, o otimismo dos ursos continua ativo

Laurie Bailey 14:55 2025-09-04 UTC+2

O índice Nasdaq 100 tem hoje potencial para se fortalecer até à resistência mais próxima. Quinta-feira, 4 de setembro de 2025

[Índice Nasdaq 100] – [Quinta-feira, 4 de setembro de 2025] Embora a EMA(50) ainda esteja abaixo da EMA(200), com o indicador RSI na área neutra-alta, isso indica um potencial

Arief Makmur 14:35 2025-09-04 UTC+2

Previsão para o EUR/USD em 4 de setembro de 2025

Na quarta-feira, o EUR/USD fez outra reversão dentro do canal horizontal a favor do euro e consolidou-se acima da zona 1,1637–1,1645. Uma recuperação a partir desta zona hoje irá favorecer

Samir Klishi 13:40 2025-09-04 UTC+2

Se o nível pivô conseguir sustentar a correção no XPD/USD, o ar pode fortalecer e subir em direção ao seu nível de resistência mais próximo. Quarta-feira, 3 de setembro de 2025

[XPD/USD] – [Quarta-feira, 03 de setembro de 2025] O XPD/USD apresenta um Death Cross nas EMAs. Embora o RSI esteja em nível neutro de baixa, enquanto não enfraquecer e fechar

Arief Makmur 16:33 2025-09-03 UTC+2

O gás natural tem potencial para enfraquecer hoje, caindo para o seu nível de suporte mais próximo. Quarta-feira, 3 de setembro de 2025

[Gás natural] – [Quarta-feira, 3 de setembro de 2025] Com a EMA (50) posicionada acima da EMA (200) e o indicador RSI na área neutra de alta hoje, o #NG

Arief Makmur 16:23 2025-09-03 UTC+2
Não pode falar agora?
Faça sua pergunta no chat.
Widget callback
 

Dear visitor,

Your IP address shows that you are currently located in the USA. If you are a resident of the United States, you are prohibited from using the services of InstaFintech Group including online trading, online transfers, deposit/withdrawal of funds, etc.

If you think you are seeing this message by mistake and your location is not the US, kindly proceed to the website. Otherwise, you must leave the website in order to comply with government restrictions.

Why does your IP address show your location as the USA?

  • - you are using a VPN provided by a hosting company based in the United States;
  • - your IP does not have proper WHOIS records;
  • - an error occurred in the WHOIS geolocation database.

Please confirm whether you are a US resident or not by clicking the relevant button below. If you choose the wrong option, being a US resident, you will not be able to open an account with InstaForex anyway.

We are sorry for any inconvenience caused by this message.