Analyzing Wednesday's trades:
EUR/USD on 1H chart
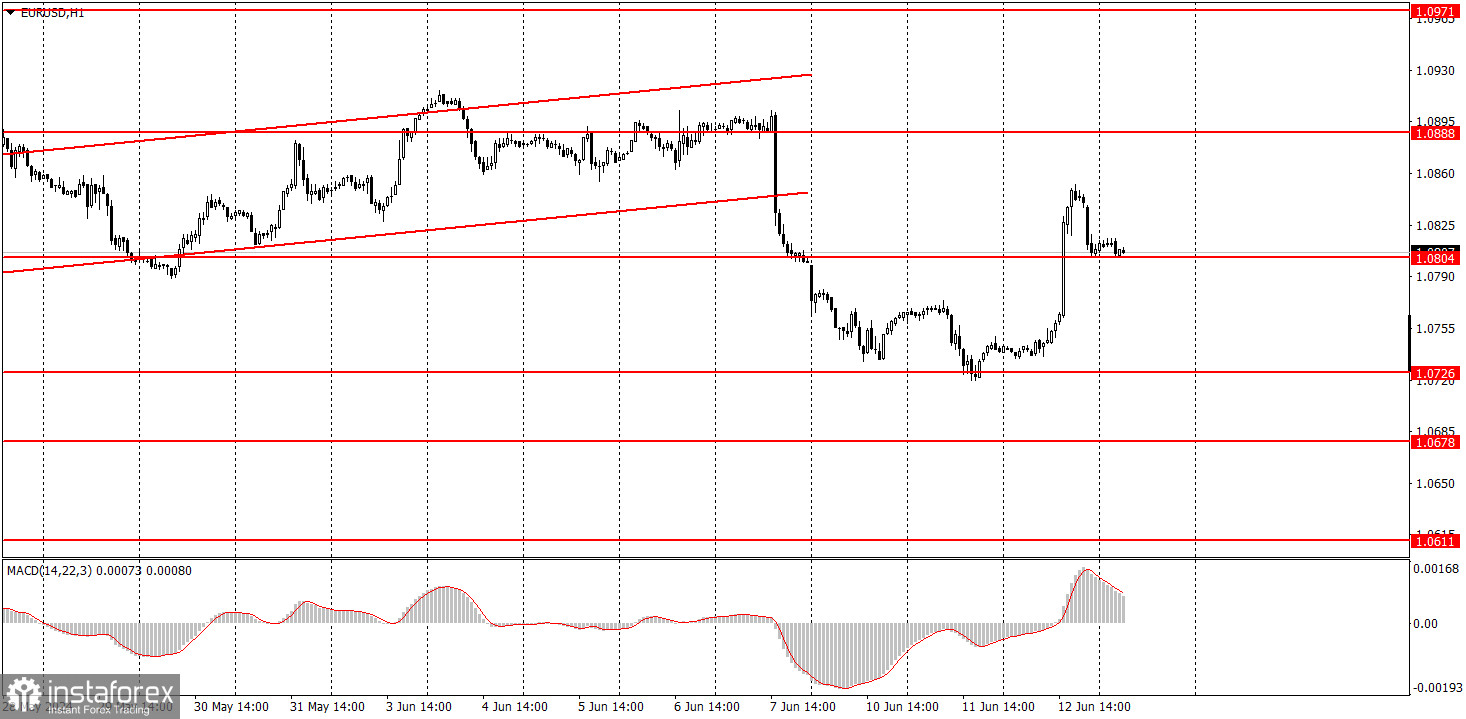
EUR/USD advanced on Wednesday after bouncing from the level of 1.0726. The bounce may seem like the reason why the euro started to rise, but that's not entirely the case. Yesterday, the US inflation report was released, which triggered the euro's rise by more than 100 pips. The Consumer Price Index slowed down to 3.3% year-on-year, decreasing by just 0.1%, similar to the previous month. We believe that the market had an excessive reaction to this report, and that the dollar's decline was way too strong. A 0.1% decrease in inflation means absolutely nothing for the Federal Reserve's monetary policy outlook, which was later confirmed by Jerome Powell himself. Inflation has eased substantially from its peak but remains too high, the Fed chair said.
Therefore, the dollar should have shown growth instead of a decline. However, the market found a formal reason to start a USD sell-off once again.
EUR/USD on 5M chart
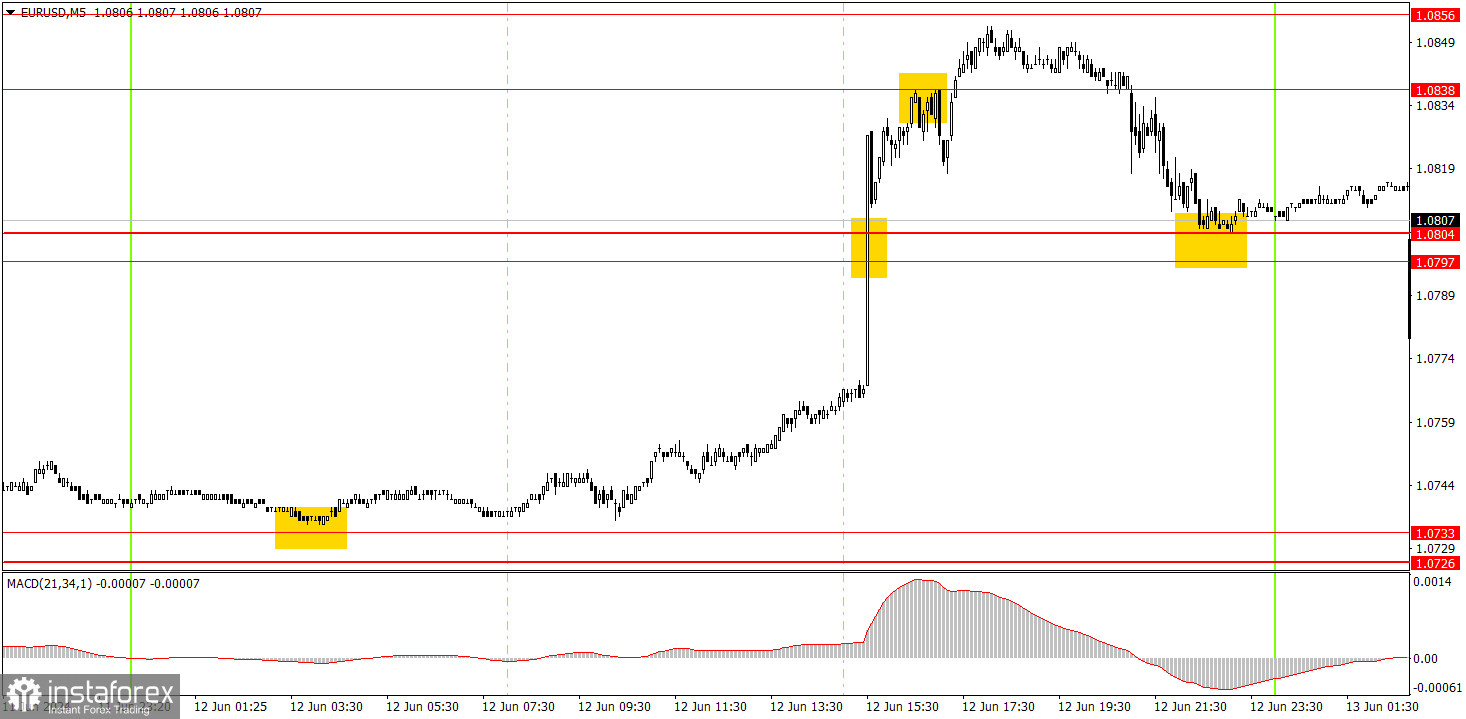
There were strong movements on the 5-minute timeframe, which presented good opportunities for trading. The pair consolidated above the range of 1.0726-1.0733 earlier in the day, and overnight into Wednesday, it bounced from the 1.0733 level. Therefore, traders could have opened long positions in the morning. By the time the inflation report was released, the trade was already in profit, so a stop loss could have been set to breakeven, and traders could continue to wait. Profit-taking could have been around the level of 1.0838. Overnight, a bounce was formed from the range of 1.0797-1.0804, which allows us to anticipate further growth on Thursday.
Trading tips on Thursday:
On the hourly chart, EUR/USD may be in the process of forming a local downtrend for the first time in a while, although yesterday's rise significantly disrupted the technical picture. The downtrend is not canceled yet, but the price should quickly resume its decline. Otherwise, the market may form a new uptrend. We believe that there were no grounds to buy the euro and sell the dollar on Wednesday. The euro's rise could be speculative.
On Thursday, traders should look for signals around the range of 1.0797-1.0804. Traders could open short positions once the price consolidates below this range, and we can expect it to return to the range of 1.0726-1.0733. You may consider longs once the price bounces from this area, and you can aim for 1.0838.
The key levels on the 5M chart are 1.0483, 1.0526, 1.0568, 1.0611, 1.0678, 1.0726-1.0733, 1.0797-1.0804, 1.0838-1.0856, 1.0888-1.0896, 1.0940, 1.0971-1.0981. Today, the Eurozone Industrial Production report will be released, while the US docket will feature a report on initial jobless claims and the Producer Price Index. These reports are of secondary importance.
Basic trading rules:
1) Signal strength is determined by the time taken for its formation (either a bounce or level breach). A shorter formation time indicates a stronger signal.
2) If two or more trades around a certain level are initiated based on false signals, subsequent signals from that level should be disregarded.
3) In a flat market, any currency pair can produce multiple false signals or none at all. In any case, the flat trend is not the best condition for trading.
4) Trading activities are confined between the onset of the European session and mid-way through the U.S. session, after which all open trades should be manually closed.
5) On the 30-minute timeframe, trades based on MACD signals are only advisable amidst substantial volatility and an established trend, confirmed either by a trendline or trend channel.
6) If two levels lie closely together (ranging from 5 to 15 pips apart), they should be considered as a support or resistance zone.
How to read charts:
Support and Resistance price levels can serve as targets when buying or selling. You can place Take Profit levels near them.
Red lines represent channels or trend lines, depicting the current market trend and indicating the preferable trading direction.
The MACD(14,22,3) indicator, encompassing both the histogram and signal line, acts as an auxiliary tool and can also be used as a signal source.
Significant speeches and reports (always noted in the news calendar) can profoundly influence the price dynamics. Hence, trading during their release calls for heightened caution. It may be reasonable to exit the market to prevent abrupt price reversals against the prevailing trend.
Beginners should always remember that not every trade will yield profit. Establishing a clear strategy coupled with sound money management is the cornerstone of sustained trading success.