Analysis of EUR/USD 5M
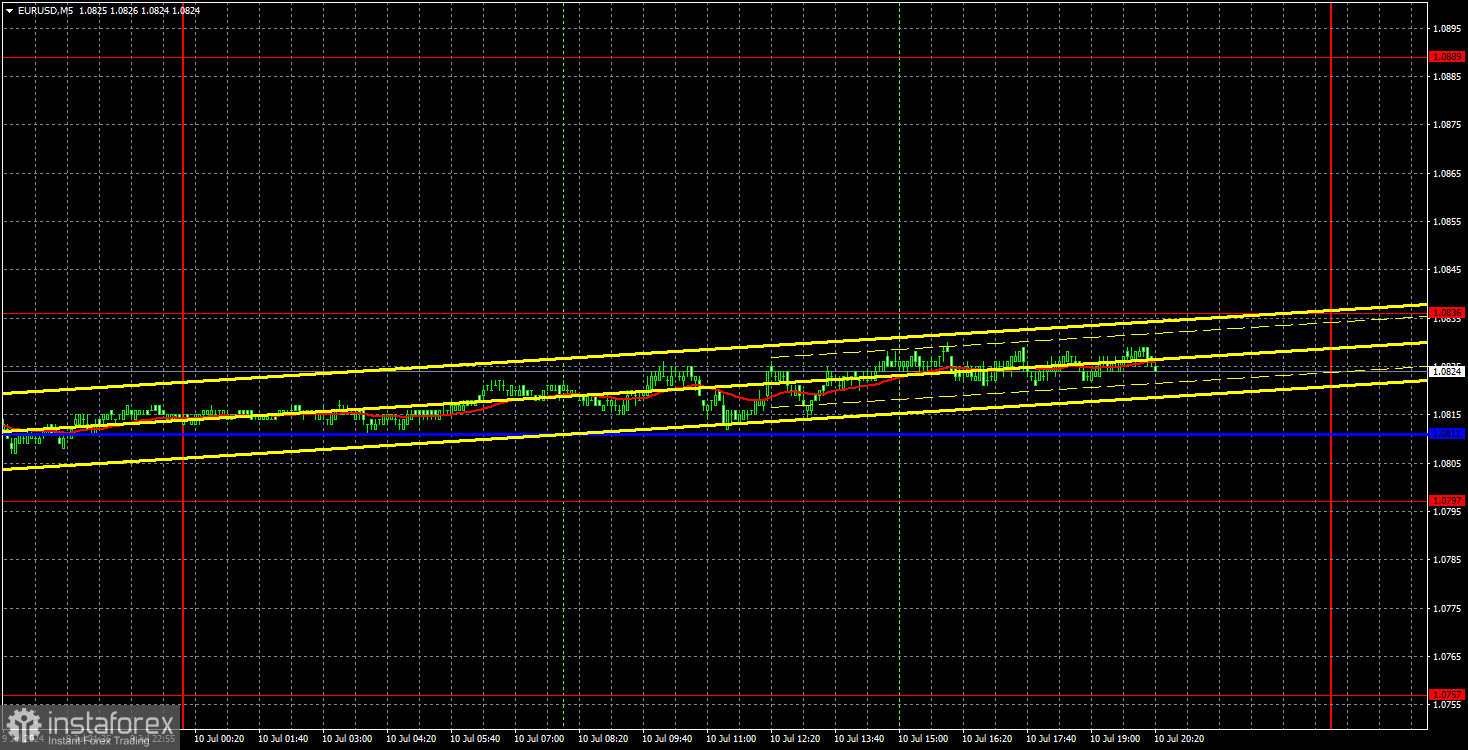
EUR/USD has completely "died." The pair went through 18 pips of volatility, and honestly, we are not even sure if it makes sense to conduct any analysis at all. Previously, we repeatedly mentioned that volatility was very weak, which generally indicates a period of market stagnation. So, how can one describe a movement of 18 pips over 20-24 hours? It would make sense if it were a semi-holiday (like July 4th). However, yesterday was just a regular trading day, and there were even fundamental events! Federal Reserve Chief Jerome Powell delivered a speech on the second day of his Congressional testimony. Even if Powell had said nothing at all, it still doesn't justify the current state of the market. Besides Powell, several other Fed policymakers also delivered speeches. And although they usually do not provoke an immediate market reaction, 18 pips of movement is still surprising.
The technical picture on the hourly timeframe has not changed. And what could possibly change after an 18-pip movement? The price remains between the levels of 1.0797 and 1.0843, and after bouncing off the latter, it failed to reach the former in three days. A low-volatility flat. The lines of the Ichimoku indicator are powerless in flat conditions, and it makes no sense to open positions at this time. For what? For a movement of 5-10 pips?
Strangely enough, one trading signal was formed yesterday. At a certain point, the price bounced off the Kijun-sen line, but of course, it didn't make any sense to work with this signal. Nevertheless, if any trader did open a long position, they might have even made a profit of 5 pips.
COT report:
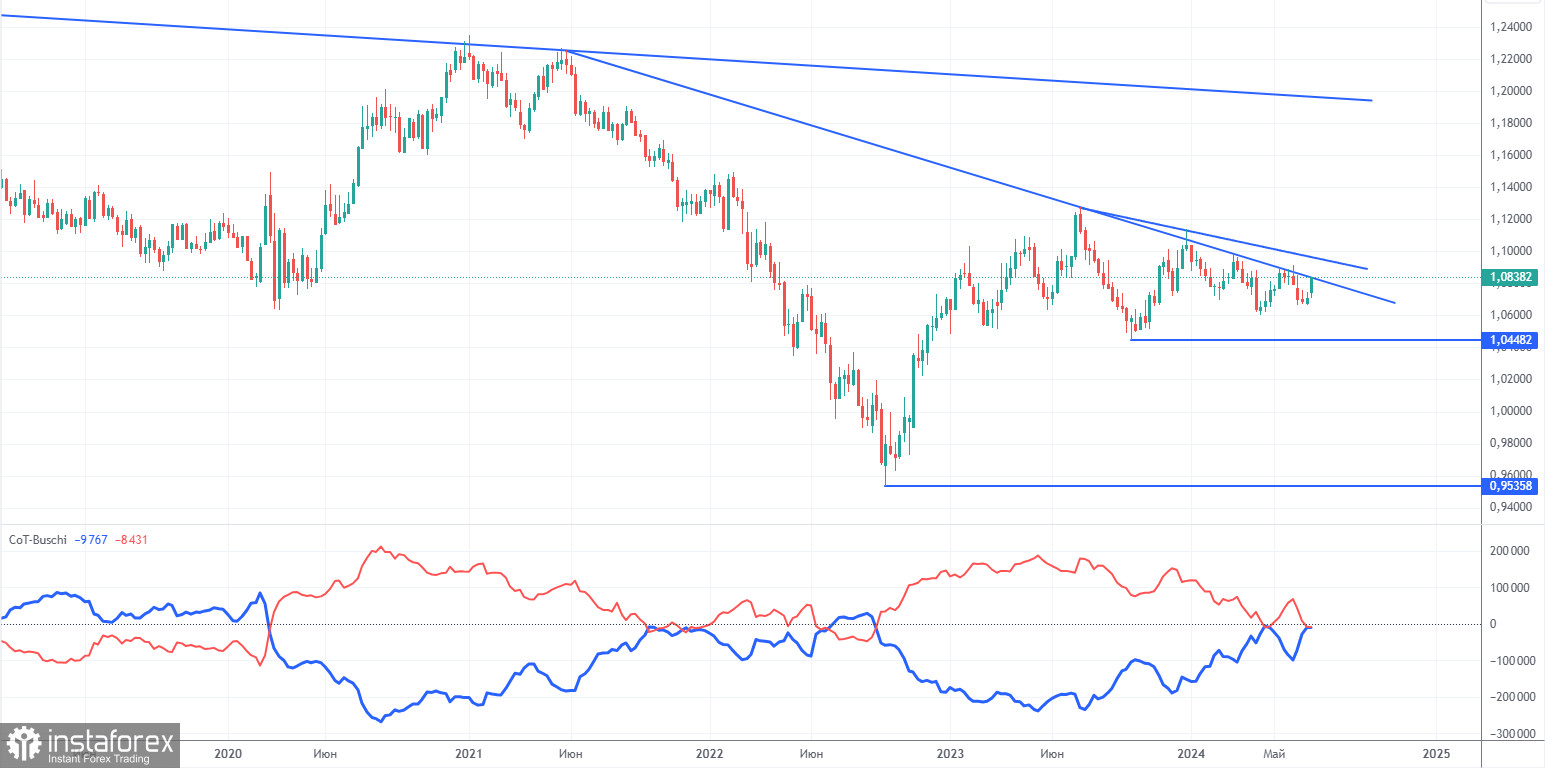
The latest COT report is dated June 25. The net position of non-commercial traders has remained bullish for a long time and remains so. The bears' attempt to gain dominance failed miserably. The net position of non-commercial traders (red line) has been declining in recent months, while that of commercial traders (blue line) has been growing. Currently, they are approximately equal, indicating the bears' new attempt to seize the initiative.
We don't see any fundamental factors that can support the euro's strength in the long term, while technical analysis also suggests a continuation of the downtrend. Three descending trend lines on the weekly chart suggests that there's a good chance of further decline. In any case, the downward trend is not broken.
Currently, the red and blue lines are approaching each other, which indicates a build-up in short positions on the euro. During the last reporting week, the number of long positions for the non-commercial group decreased by 4,100, while the number of short positions increased by 12,300. As a result, the net position decreased by 16,400. According to the COT reports, the euro still has significant potential for a decline.
Analysis of EUR/USD 1H
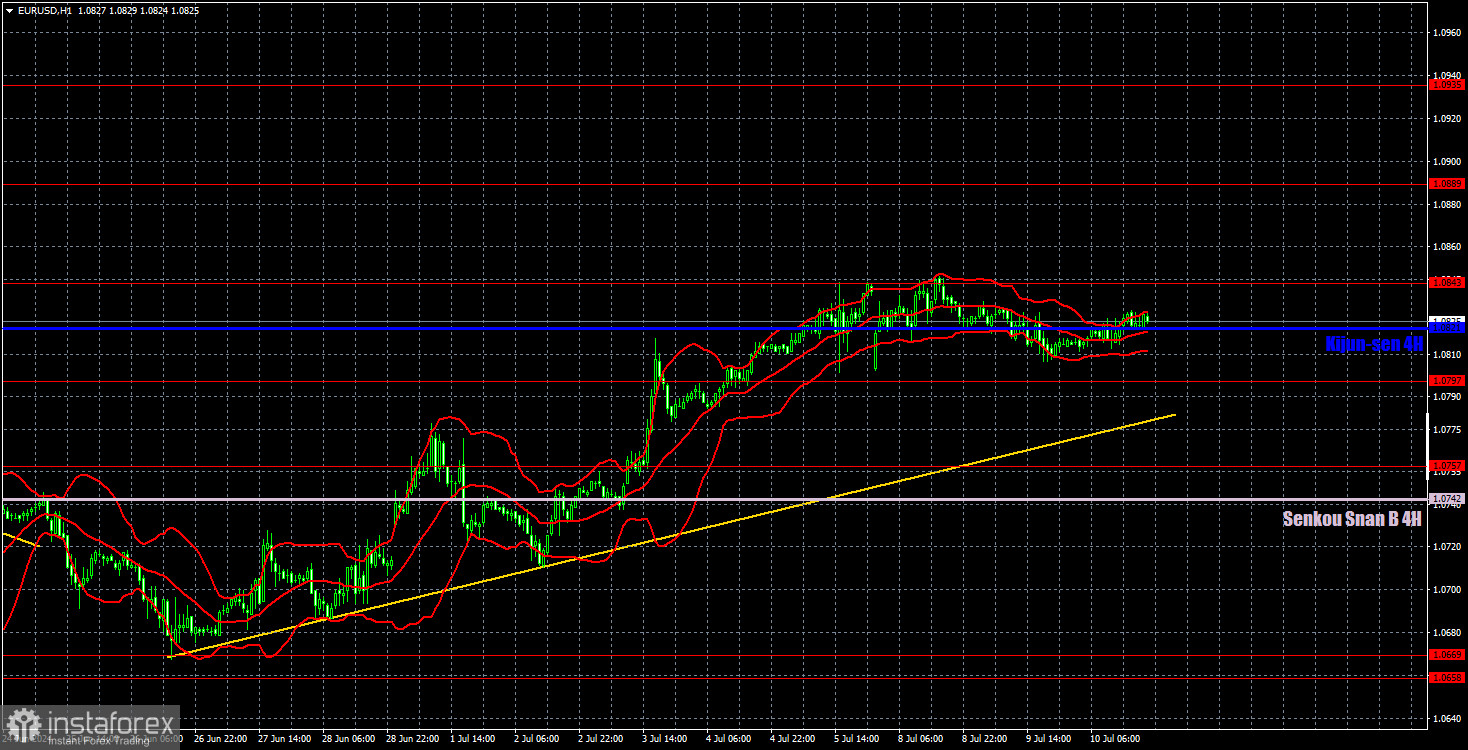
On the 1-hour chart, EUR/USD failed to break through the 1.0658-1.0669 area and decided to form a new upward trend. We currently have an ascending trend line, above which the upward trend persists. It may end this week, but it will take at least a few days for the price to fall to the trendline. It is impossible to confirm the end of the uptrend without breaking through this line and the Ichimoku indicator lines. Moreover, the US inflation report could mount pressure on the dollar.
On July 11, we highlight the following levels for trading: 1.0530, 1.0581, 1.0658-1.0669, 1.0757, 1.0797, 1.0843, 1.0889, 1.0935, 1.1006, 1.1092, as well as the Senkou Span B lines (1.0742) and Kijun-sen (1.0821). The Ichimoku indicator lines can move during the day, so this should be taken into account when identifying trading signals. Don't forget to set a Stop Loss to breakeven if the price has moved in the intended direction by 15 pips. This will protect you against potential losses if the signal turns out to be false.
Today, the main item on this week's agenda will be published in the US. The Consumer Price Index has previously triggered a sharp decline in the US dollar twice. It is quite possible that we will see something similar this time. Over the past few days, the price hasn't been able to properly correct downward. We will not be surprised if the euro rises again.
Description of the chart:
Support and resistance levels are thick red lines near which the trend may end. They do not provide trading signals;
The Kijun-sen and Senkou Span B lines are the lines of the Ichimoku indicator, plotted to the 1H timeframe from the 4H one. They provide trading signals;
Extreme levels are thin red lines from which the price bounced earlier. They provide trading signals;
Yellow lines are trend lines, trend channels, and any other technical patterns;
Indicator 1 on the COT charts is the net position size for each category of traders;