Analyzing Wednesday's trades:
EUR/USD on 1H chart
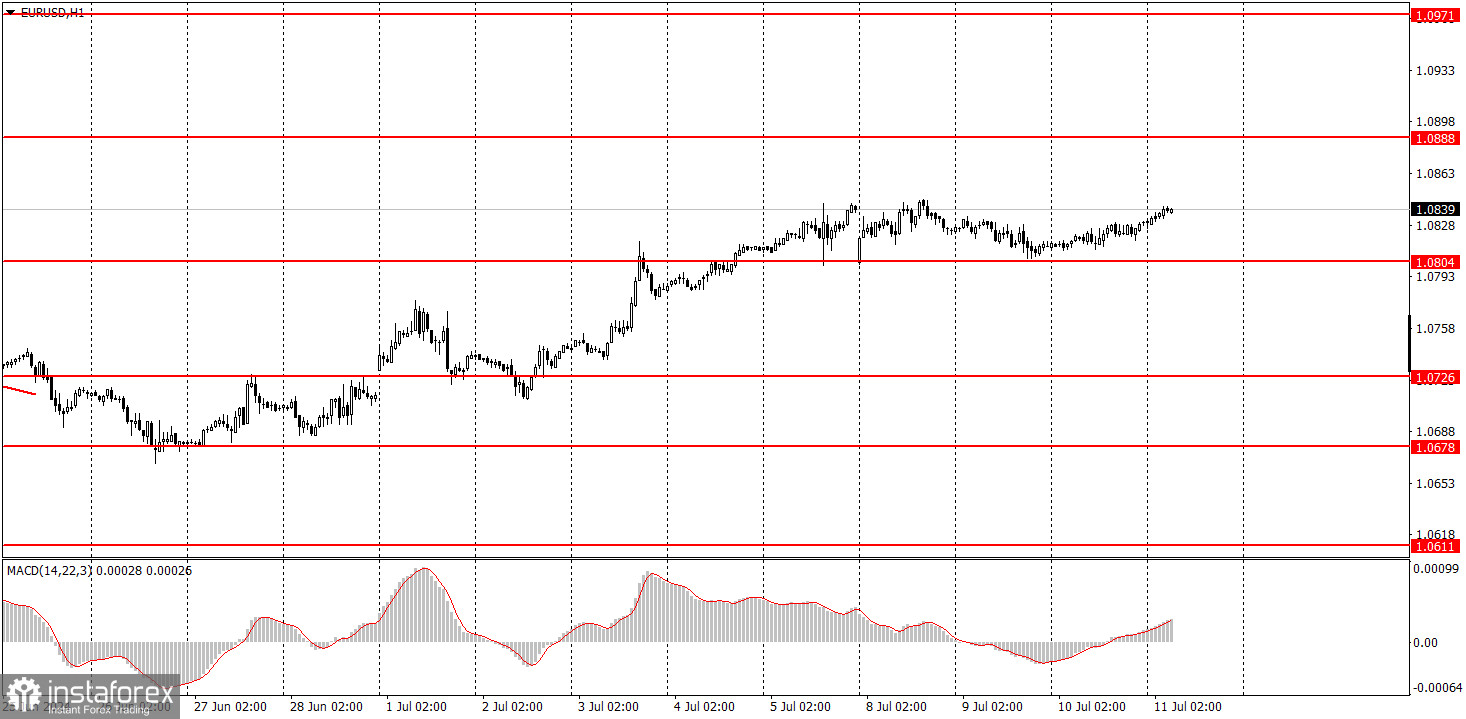
EUR/USD continued to appreciate on Wednesday. However, the main point isn't that the pair extended gains, but rather that volatility has dropped to just 19 pips per day. In general, it doesn't matter in which direction the pair moves, because there are no significant movements. Imagine if it took two weeks to cover 100 pips in one direction. Who would be interested in that? Volatility has been steadily decreasing over the past 6-12 months. It's quite difficult to say why this has happened, especially since there's plenty of fundamental and macroeconomic background. The market has grounds to make trades. Of course, there are occasional periods of flat trading on the market, but we are not currently in such a period.
Yesterday, the only event of the day was Federal Reserve Chief Jerome Powell's second testimony before the US Congress. By observing the pair's movements, one can easily conclude how much the market was interested in this event. Powell's testimony provided no new revelations about the US central bank's future course of actions.
EUR/USD on 5M chart
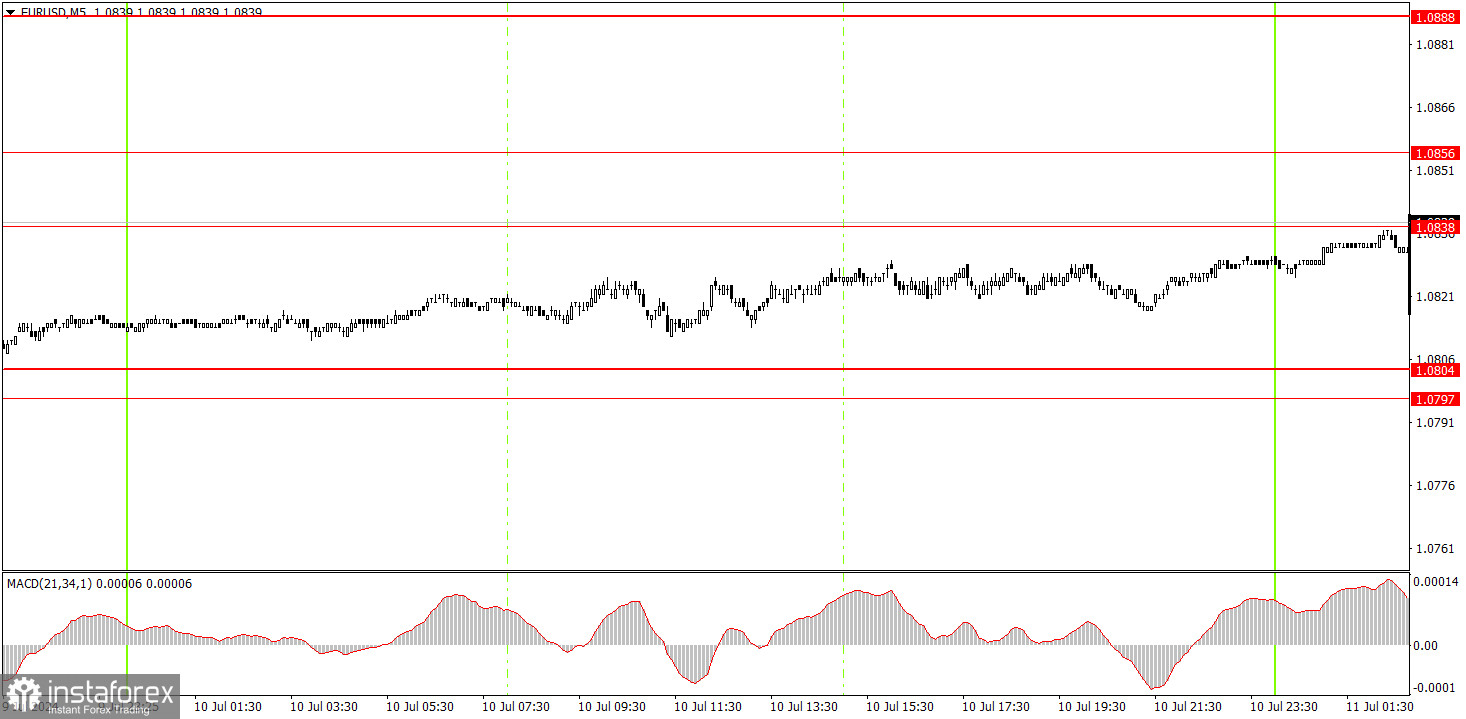
The pair did not form any trading signal on the 5-minute time frame. It would have been naive to expect even one signal with volatility at 19 pips. The only option would have been to open positions on Tuesday evening when the price bounced off the 1.0804 level. We have repeatedly warned novice traders that even on the smallest time frames, trades need to be held for 1-3 days to expect any profit.
Trading tips on Thursday:
On the hourly chart, EUR/USD is unable to break through the 1.0678 level, and last week's economic reports had a devastating effect on the dollar. Therefore, it was logical for the euro to rise. Despite this movement, the overall (downward) trend has not changed, but the euro has been frequently trading with strong corrections over the past 7-8 months. Formally, the euro is in a downward trend, as seen on the higher time frames, but the process of the pair's decline in the medium-term has been extremely slow.
On Thursday, beginners can trade from the 1.0838-1.0856 area. Today, volatility may increase due to the US inflation report, but to what extent will it increase? Even a movement of 40 pips can hardly be called interesting enough.
The key levels on the 5M chart are 1.0483, 1.0526, 1.0568, 1.0611, 1.0678, 1.0726-1.0733, 1.0797-1.0804, 1.0838-1.0856, 1.0888-1.0896, 1.0940, 1.0971-1.0981. Today, the US docket will feature the crucial inflation report for June and a secondary report on unemployment claims. Germany will also release the second estimate of its inflation report for June, which is of secondary importance.
Basic trading rules:
1) Signal strength is determined by the time taken for its formation (either a bounce or level breach). A shorter formation time indicates a stronger signal.
2) If two or more trades around a certain level are initiated based on false signals, subsequent signals from that level should be disregarded.
3) In a flat market, any currency pair can produce multiple false signals or none at all. In any case, the flat trend is not the best condition for trading.
4) Trading activities are confined between the onset of the European session and mid-way through the U.S. session, after which all open trades should be manually closed.
5) On the 30-minute timeframe, trades based on MACD signals are only advisable amidst substantial volatility and an established trend, confirmed either by a trendline or trend channel.
6) If two levels lie closely together (ranging from 5 to 15 pips apart), they should be considered as a support or resistance zone.
How to read charts:
Support and Resistance price levels can serve as targets when buying or selling. You can place Take Profit levels near them.
Red lines represent channels or trend lines, depicting the current market trend and indicating the preferable trading direction.
The MACD(14,22,3) indicator, encompassing both the histogram and signal line, acts as an auxiliary tool and can also be used as a signal source.
Significant speeches and reports (always noted in the news calendar) can profoundly influence the price dynamics. Hence, trading during their release calls for heightened caution. It may be reasonable to exit the market to prevent abrupt price reversals against the prevailing trend.
Beginners should always remember that not every trade will yield profit. Establishing a clear strategy coupled with sound money management is the cornerstone of sustained trading success.