Analyzing Thursday's trades:
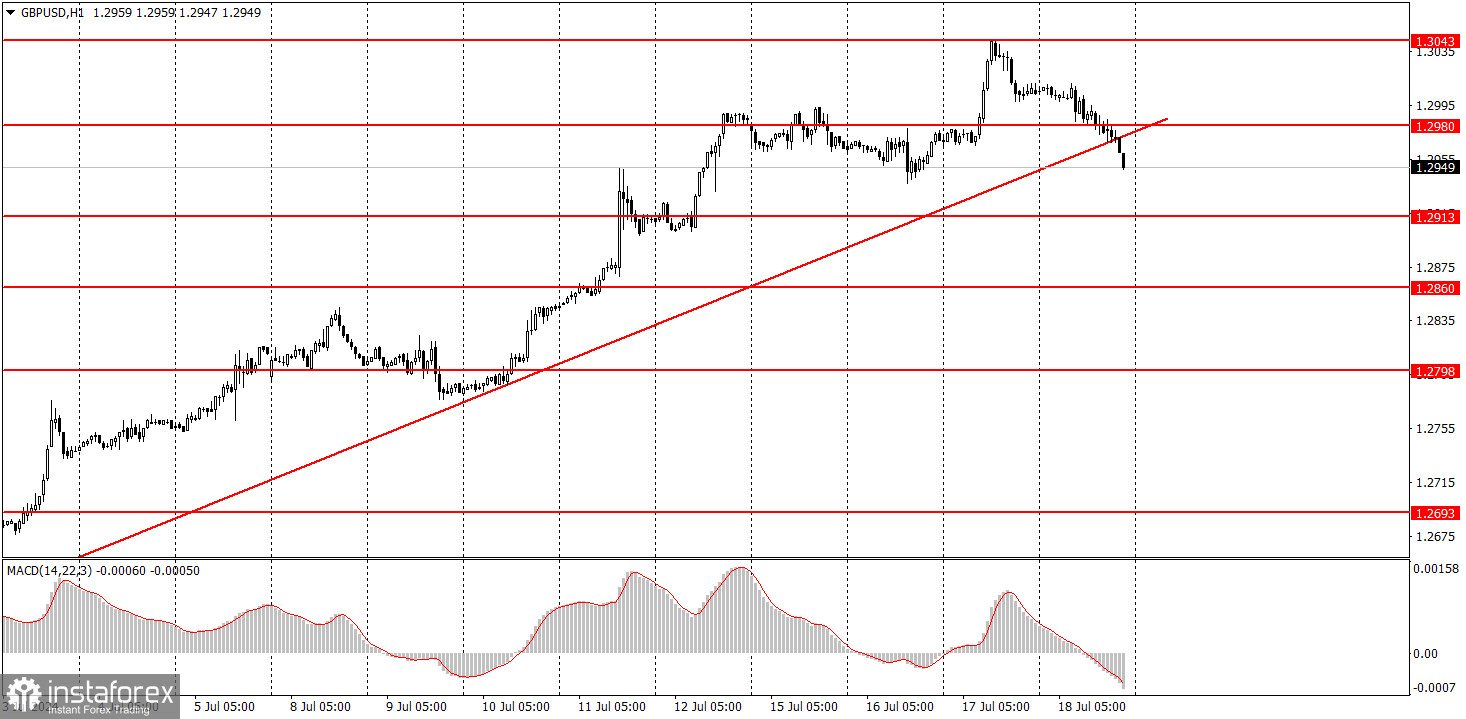
GBP/USD on 1H chart
GBP/USD faced a minor bearish correction on Thursday, and tested the ascending trendline. Unfortunately, the current reality is such that the price could react in any way around the trendline, but the most likely outcome is a new rise in the British currency. It is noteworthy that over the past few months, five or six ascending trendlines have been formed on the hourly timeframe. Each time the price settled below such a line, a downward trend did not follow. Therefore, at this time, a consolidation below the trendline does not guarantee a downtrend.
Yesterday, data on unemployment and wages were published in the UK. Almost all the reports matched the forecast values, so the market had a small reaction to these reports, as was the overall volatility of the day, which was approximately 50 pips. The British pound maintains excellent positions, and it is still quite difficult to say what can provoke the market to start selling the pound. At the same time, a decline in the pound is the most logical development. Clear signals of a trend change are necessary.
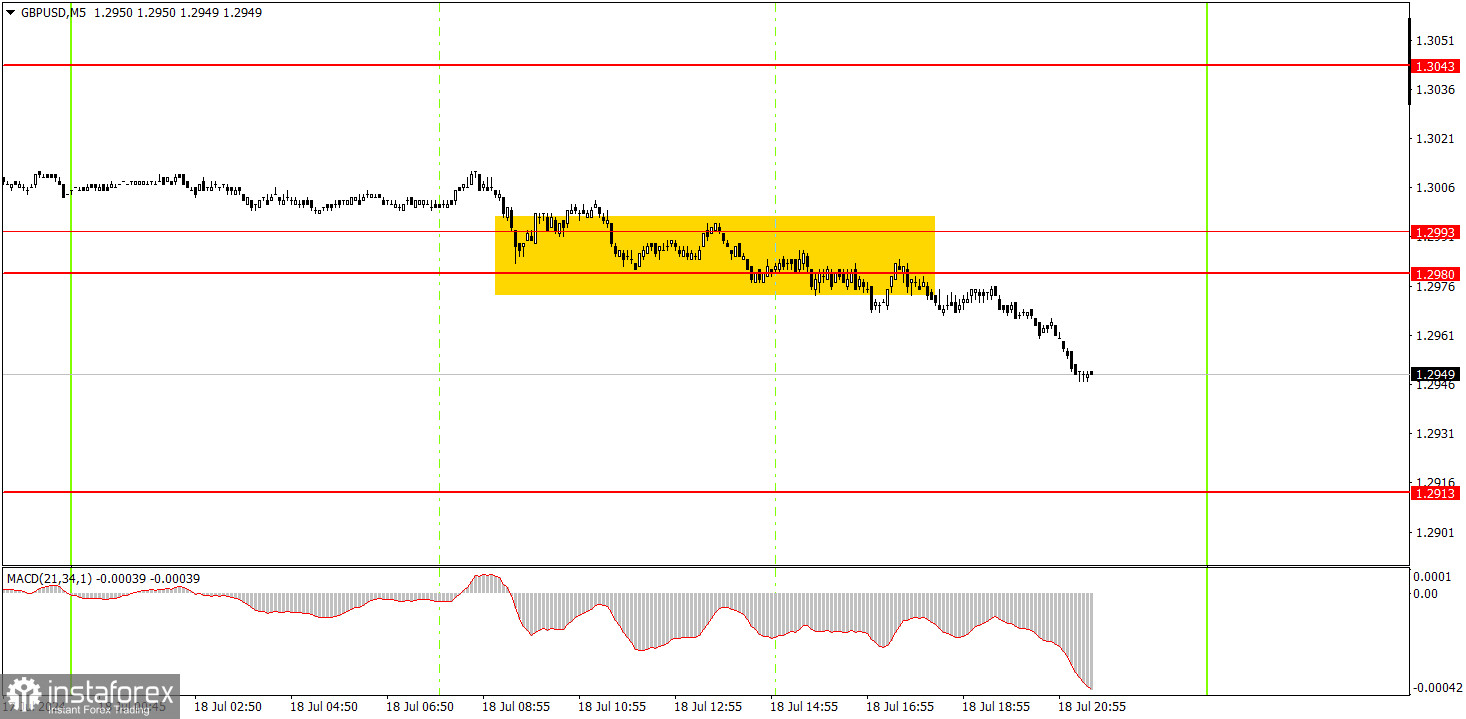
GBP/USD on 5M chart
The price did not form any trading signals on the 5-minute timeframe. For about six or seven hours, the pair edged lower around the support area of 1.2980-1.2993. The price eventually overcame this area, so by the end of the day, novice traders still received a sell signal. Traders could even execute this signal despite the late hour, as it is now impossible to rely on a signal or even expect the pair to reach the first target within a single day.
Trading tips on Friday:
On the hourly chart, GBP/USD continues to show promising signs of forming a downtrend, but the local upward trend is still intact. The pair shows a bullish bias, and it continues to exhibit illogical movements. At this time, the pound sterling surpassed its latest local high and continues to ignore the fundamental backdrop. The market also uses almost any report as an excuse to buy the British currency.
On Friday, the pound sterling may attempt to extend its downward movement, as the pair overcame the 1.2980-1.2993 area. However, we do not expect a sharp fall from the pound.
The key levels on the 5M chart are 1.2605-1.2633, 1.2684-1.2693, 1.2748, 1.2791-1.2798, 1.2848-1.2860, 1.2913, 1.2980-1.2993, 1.3043, 1.3102-1.3107, 1.3145. Today, the UK will publish a retail sales report, which is the only more or less important event of the day. If we did not see strong movements in the past few days, when the macroeconomic background was much stronger, then there's almost no chance of seeing such movements on Friday.
Basic trading rules:
1) Signal strength is determined by the time taken for its formation (either a bounce or level breach). A shorter formation time indicates a stronger signal.
2) If two or more trades around a certain level are initiated based on false signals, subsequent signals from that level should be disregarded.
3) In a flat market, any currency pair can produce multiple false signals or none at all. In any case, the flat trend is not the best condition for trading.
4) Trading activities are confined between the onset of the European session and mid-way through the U.S. session, after which all open trades should be manually closed.
5) On the 30-minute timeframe, trades based on MACD signals are only advisable amidst substantial volatility and an established trend, confirmed either by a trendline or trend channel.
6) If two levels lie closely together (ranging from 5 to 15 pips apart), they should be considered as a support or resistance zone.
How to read charts:
Support and Resistance price levels can serve as targets when buying or selling. You can place Take Profit levels near them.
Red lines represent channels or trend lines, depicting the current market trend and indicating the preferable trading direction.
The MACD(14,22,3) indicator, encompassing both the histogram and signal line, acts as an auxiliary tool and can also be used as a signal source.
Significant speeches and reports (always noted in the news calendar) can profoundly influence the price dynamics. Hence, trading during their release calls for heightened caution. It may be reasonable to exit the market to prevent abrupt price reversals against the prevailing trend.
Beginners should always remember that not every trade will yield profit. Establishing a clear strategy coupled with sound money management is the cornerstone of sustained trading success.