Analysis of EUR/USD 5M
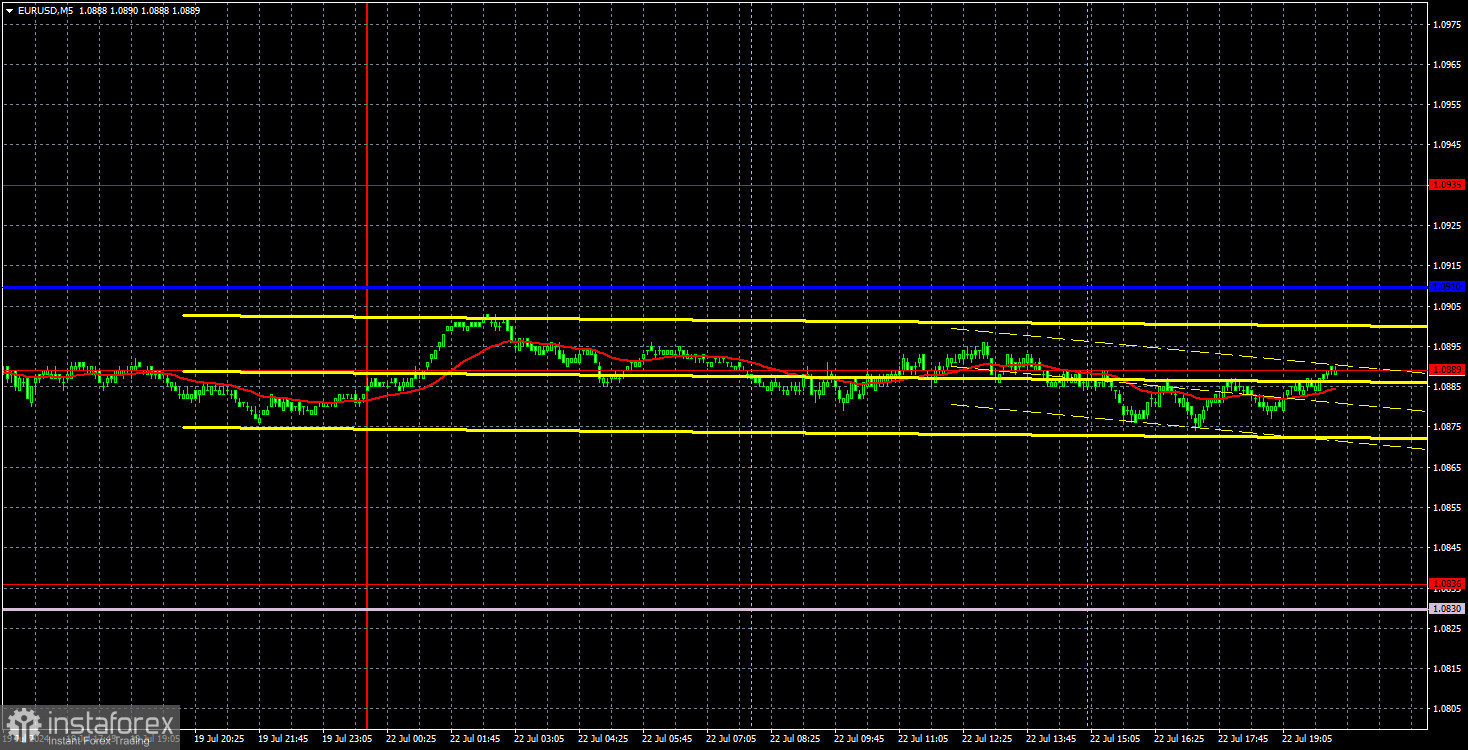
On Monday, EUR/USD traded sideways, with extremely low volatility. Market participants have long been accustomed to 20-30 pips of movement in one direction in a single day, which is considered a significant event. There is nothing to analyze today since there were no market movements yesterday. There was no macroeconomic data and no fundamental events. The pair remained flat throughout the day.
The ascending trendline remains relevant, but it's worth noting that breaking trendlines in a flat market is not considered a signal of a trend change. We expect the pair to become more volatile by the middle of the week, although hopes for this are not very high. Over the past six months, volatility has consistently decreased and continues to do so now. On the 24-hour timeframe, it's clear that the price is consolidating in an increasingly narrow range. We are likely witnessing a global "calm before the storm."
The pair did not generate any trading signals on Monday, and the same goes for Friday. To be precise, the price crossed the 1.0889 level multiple times over these two days, but it makes no sense to consider trading signals and opening positions with volatility of 25-30 pips.
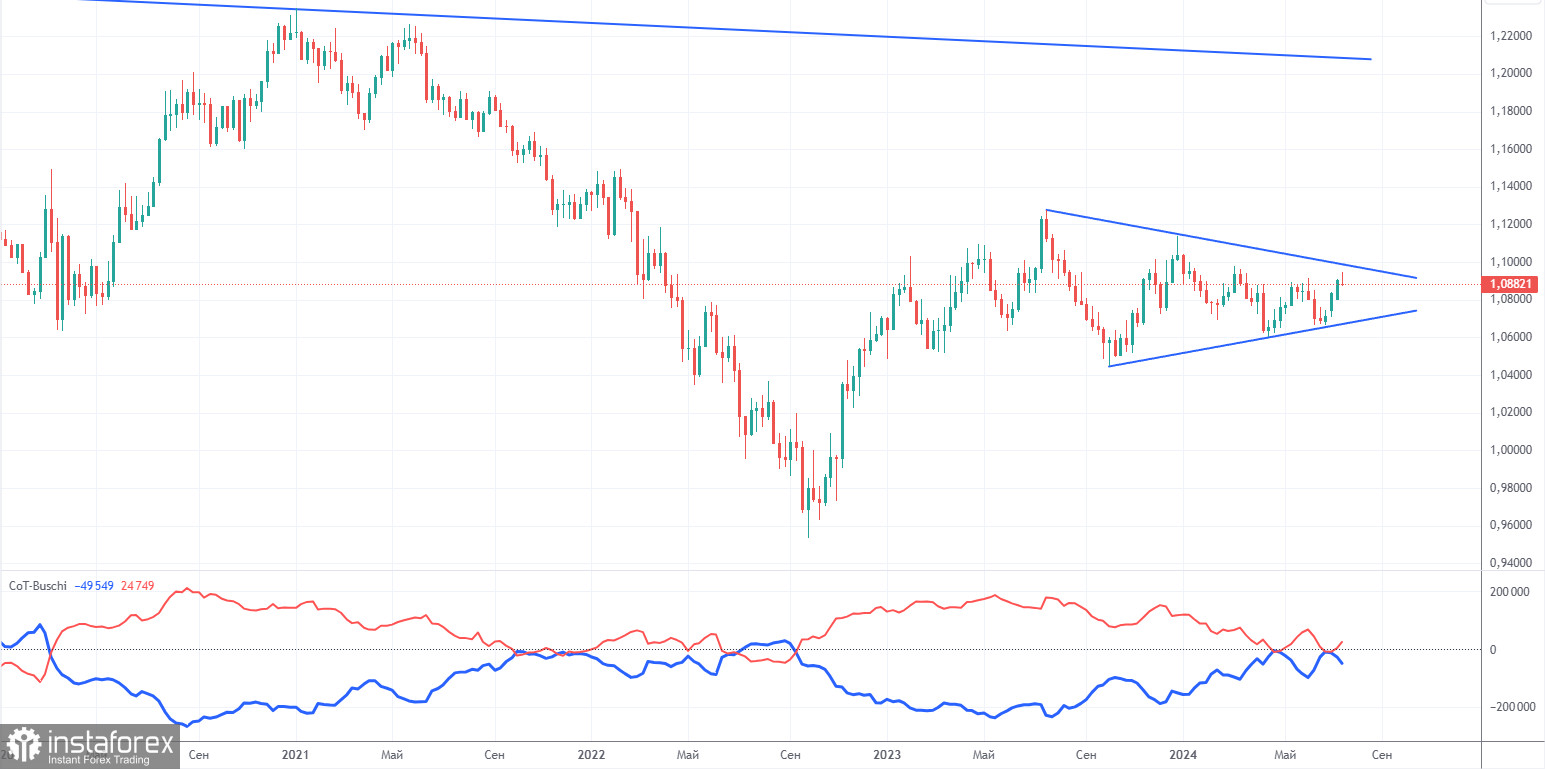
COT report:
The latest COT report is dated July 16. The net position of non-commercial traders has remained bullish for a long time. The bears' attempt to gain dominance failed miserably. In recent months, the net position of non-commercial traders (red line) has been declining, while that of commercial traders (blue line) has been growing. They are now approximately equal, indicating a new attempt by the bears to take the initiative.
We still do not see any fundamental factors that can support the euro to strengthen further, and technical analysis indicates that the price is in a consolidation zone—within a triangle. The future movement of the pair will depend on which boundary the price leaves through.
The red and blue lines are approaching each other, indicating a build-up in short positions in the euro. During the last reporting week, the number of long positions for the non-commercial group increased by 14,100, while the number of short positions decreased by 7,000. As a result, the net position increased by 21,100. According to the COT reports, the euro has a significant potential for a decline.
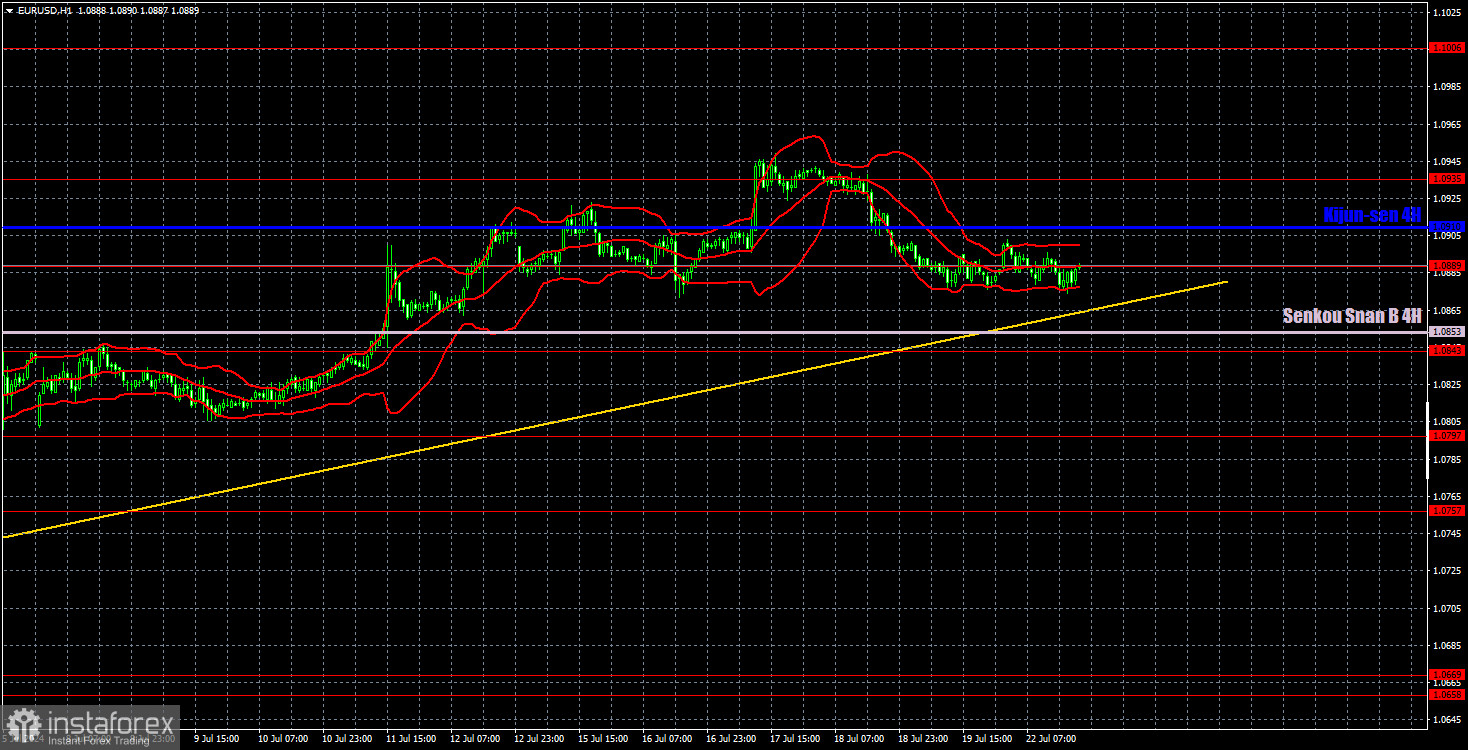
Analysis of EUR/USD 1H
On the hourly timeframe, EUR/USD continues to form an uptrend. We currently have an ascending trend line, above which the upward trend remains intact. Almost all the economic reports from the past three weeks had a detrimental effect on the dollar, even when the data were favorable to the dollar. Meanwhile, the global downtrend persists on the 24-hour timeframe, meaning the pair could still fall back to the 1.06 level. Currently, the market is showing flat dynamics.
On July 23, we highlight the following levels for trading: 1.0530, 1.0581, 1.0658-1.0669, 1.0757, 1.0797, 1.0843, 1.0889, 1.0935, 1.1006, 1.1092, as well as the Senkou Span B (1.0853) and Kijun-sen (1.0910) lines. The Ichimoku indicator lines may shift throughout the day, which should be considered when identifying trading signals. Remember to set a Stop Loss to breakeven if the price has moved in the intended direction by 15 pips. This will protect you against potential losses in case of false signals.
No significant events are scheduled on Tuesday in the Eurozone or the United States. Therefore, the pair may experience low volatility, and the euro may continue to edge lower gradually or stay flat. A decline is still the most logical scenario for the euro. In the 24-hour timeframe, the pair bounced off a significant level at 1.0940 (50.0% Fibonacci retracement). Furthermore, the price is at the upper boundary of the horizontal channel on the same daily timeframe.
Description of the chart:
Support and resistance levels are thick red lines near which the trend may end. They do not provide trading signals.
The Kijun-sen and Senkou Span B lines are the lines of the Ichimoku indicator, plotted to the 1H timeframe from the 4H one. They are strong lines.
Extreme levels are thin red lines from which the price bounced earlier. They provide trading signals.
Yellow lines are trend lines, trend channels, and any other technical patterns.
Indicator 1 on the COT charts is the net position size for each category of traders.