Analyzing Tuesday's trades:
EUR/USD on 1H chart
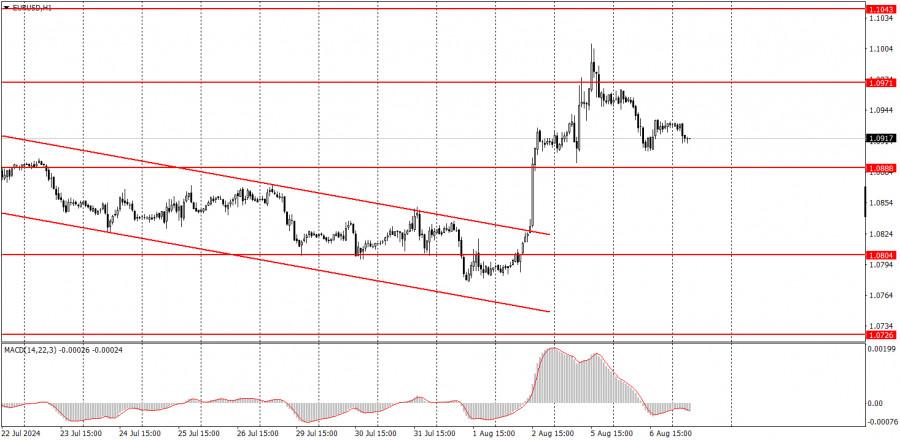
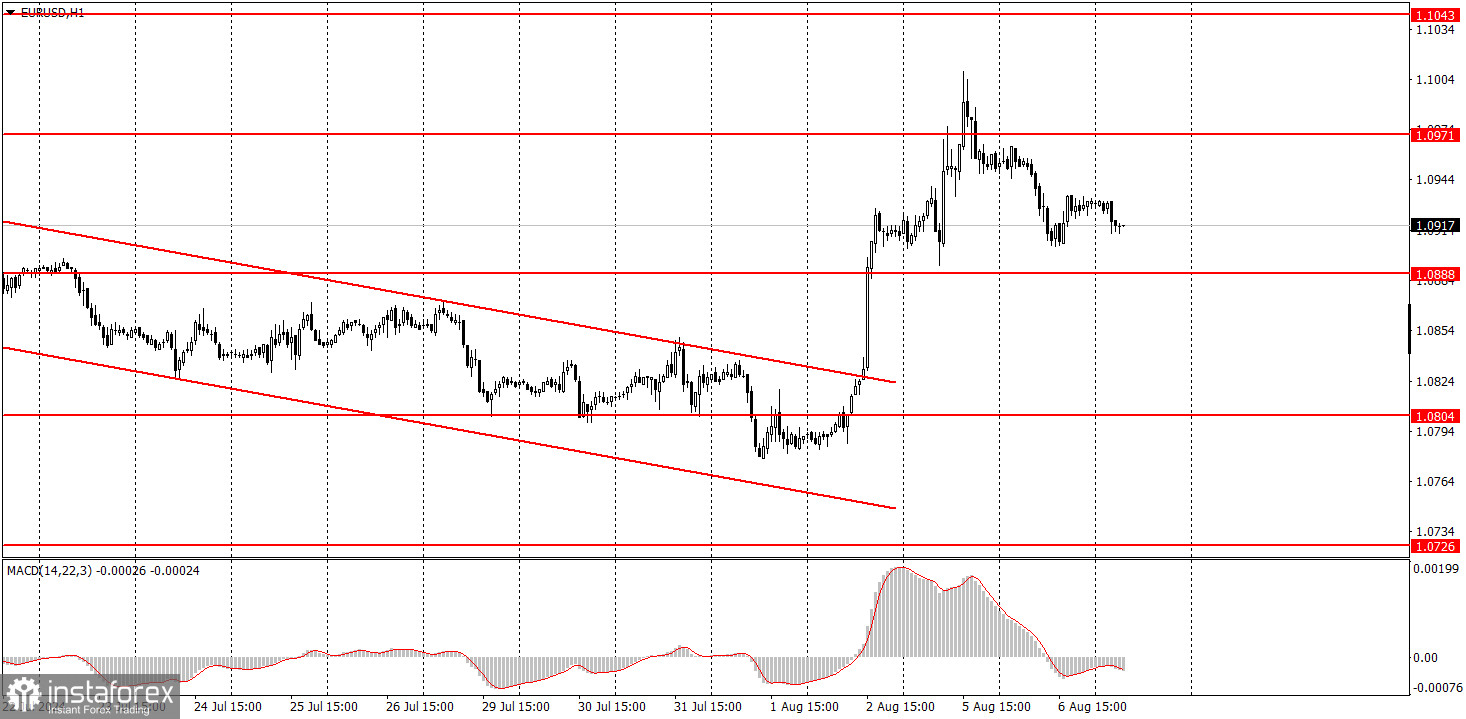
The EUR/USD pair traded more calmly on Tuesday. The market started to "recover" from Friday's events and Monday's panic, and the macroeconomic background on that day was practically absent. As a result, volatility decreased to average levels, and the price continued to fall moderately. We do not understand the reasons for the market panic on Monday and, accordingly, believe that the US dollar once again fell "on flat ground." Yes, the labor market and unemployment reports were again worse than forecasts, but this does not mean the Federal Reserve will start easing monetary policy tomorrow. Since the beginning of the year, the market has expected the Fed to lower rates soon. And as of the beginning of August, it still has yet to happen. The labor market and unemployment data have shown weak values for at least four months. However, only in August did the market begin to think that a recession had started and that the Fed urgently needed to intervene. The pair remains within the horizontal channel of 1.06-1.10. We expect a move to the lower boundary of this channel.
EUR/USD on 5M chart
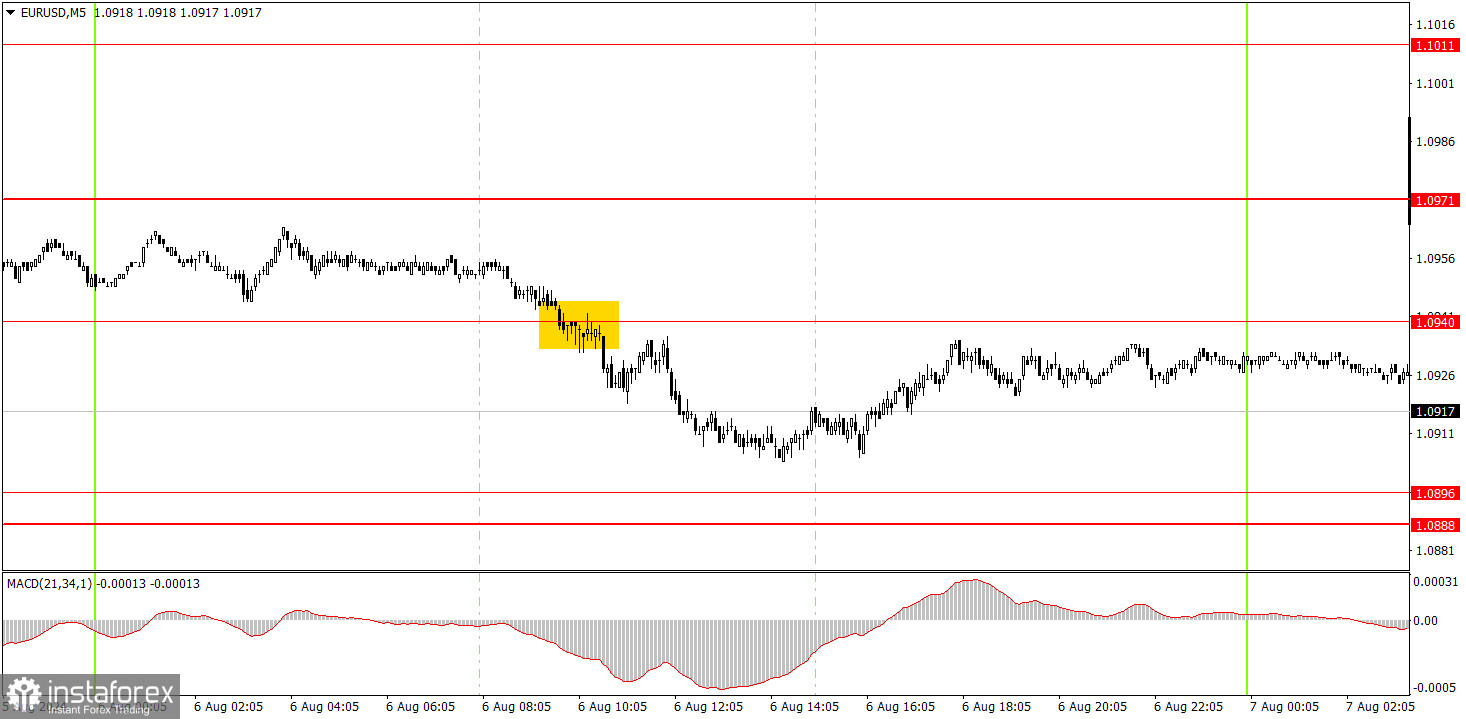
One reasonably good sell signal was formed in the 5-minute time frame on Tuesday. During the European trading session, the price consolidated below the level of 1.0940 and almost reached the nearest target area of 1.0888-1.0896. However, it fell short. By the end of the day, quotes pulled back up, so novice traders could only manually close the trade with a small profit.
Trading tips on Wednesday:
EUR/USD surged and broke the short-term downward trend in the hourly time frame. We believe the euro has fully factored in all the bullish factors, so we do not expect the upward movement to continue. The economic reports let the dollar down again on Friday, but this does not mean the greenback will depreciate every day. The 24-hour timeframe continues to show a flat range between 1.06 and 1.10. There are currently no reasons to leave this range.
On Wednesday, novice traders can trade from the nearest levels. The pair is currently showing good movements, with a sufficient number of signals forming. However, volatility may decrease, and the bearish correction may continue.
The key levels to consider on the 5M timeframe are 1.0526, 1.0568, 1.0611, 1.0678, 1.0726-1.0733, 1.0797-1.0804, 1.0838-1.0856, 1.0888-1.0896, 1.0940, 1.0971, 1.1011, 1.1043, and 1.1091. The only report scheduled for Wednesday is industrial production in Germany. We still expect the US dollar to recover.
Basic rules of the trading system:
1) The strength of a signal is determined by the time it took for the signal to form (bounce or level breakthrough). The shorter the time required, the stronger the signal.
2) If two or more trades around a certain level are initiated based on false signals, subsequent signals from that level should be ignored.
3) In a flat market, any currency pair can produce multiple false signals or none at all. In any case, it's better to stop trading at the first signs of a flat market.
4) Trades should be opened between the start of the European session and mid-way through the U.S. session. All trades must be closed manually after this period.
5) In the hourly time frame, trades based on MACD signals are only advisable amidst substantial volatility and an established trend, confirmed either by a trendline or trend channel.
6) If two levels are too close to each other (from 5 to 20 pips), they should be considered as a support or resistance zone.
7) After moving 15 pips in the intended direction, the Stop Loss should be set to break-even.
What's on the charts:
Support and Resistance price levels: targets when opening long or short positions. You can place Take Profit levels near them.
Red lines represent channels or trend lines that depict the current trend and indicate the preferred trading direction.
The MACD (14,22,3) indicator, encompassing both the histogram and signal line, acts as an auxiliary tool and can also be used as a source of signals.
Important speeches and reports (always noted in the news calendar) can profoundly influence the price dynamics. Hence, trading during their release calls for heightened caution. It may be reasonable to exit the market to prevent abrupt price reversals against the prevailing trend.
Beginners should always remember that not every trade will yield profit. Establishing a clear strategy, coupled with effective money management, is key to long-term success in trading.