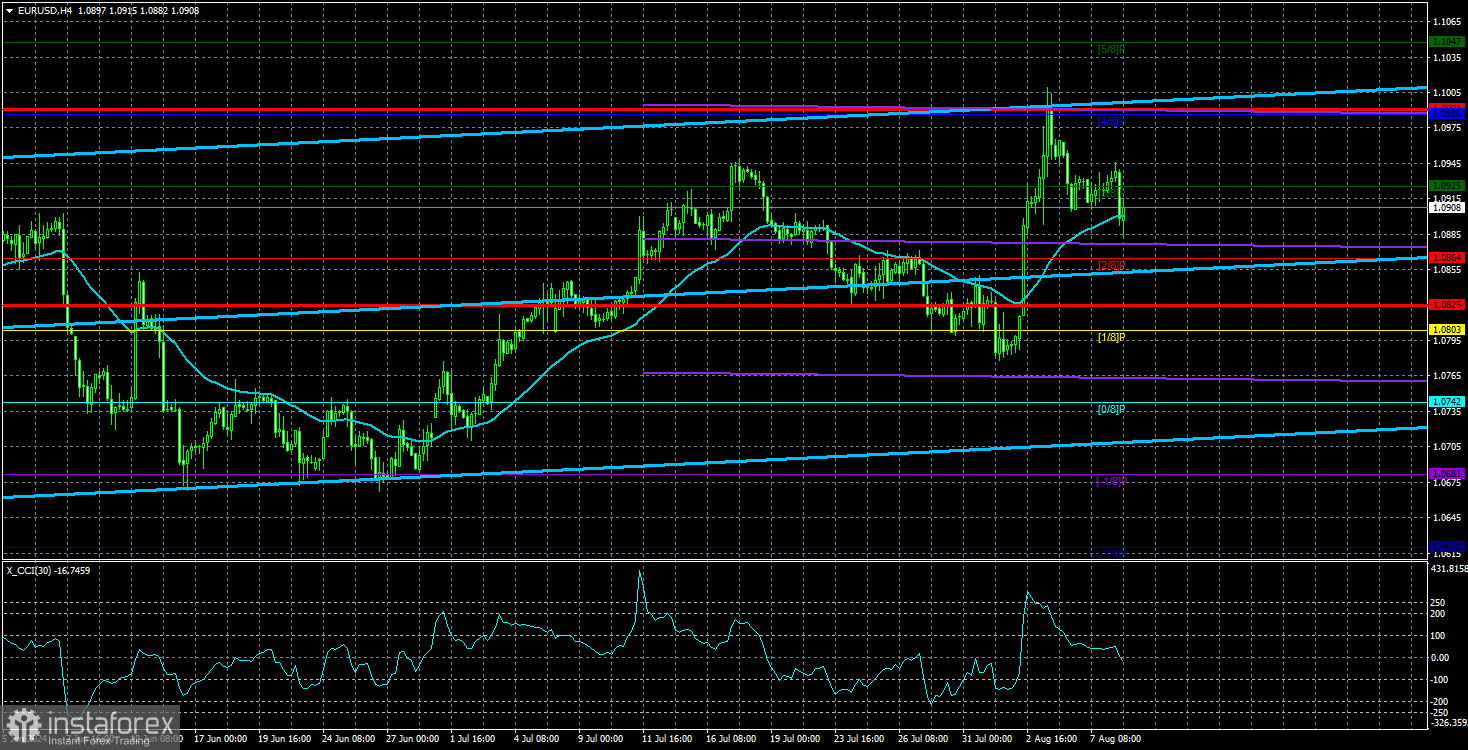
On Thursday, the EUR/USD pair generally sustained its decline. The price worked through the moving average line during the day but failed to overcome it. Thus, technically, the dollar's prospects remain unclear. Its technical picture looks optimistic in the 24-hour time frame, where the horizontal channel of 1.06-1.10 persists. And since the price rebounded from the upper boundary of this channel just this week, traders can now expect it to drop to the lower boundary. However, it should be understood that the flat will not last forever; it will end sooner or later.
In the 4-hour time frame, the picture is somewhat worse. To strengthen the US dollar further, it needs to consolidate below the moving average, which has yet to occur. However, even here, things are not as bad as they seem. A rebound from the moving average is always a normal reaction. It does not indicate that a local upward trend will now resume. Remember, the CCI indicator entered the overbought area twice and formed a bearish divergence. Thus, a decline in the pair remains the most likely technical scenario.
In macroeconomic terms, things are consistently bad for the dollar for several reasons. The first is the overestimated forecasts for key macroeconomic indicators. We have already mentioned that the dollar could fall indefinitely in such a mode. The market expects much more from each report than what might be realistic. Exaggerated forecasts are only sometimes present but quite often. No one denies that many reports in the last 3-4 months have been weak, but there have also been strong reports recently, such as the ISM Services Sector Business Activity Index and the GDP for the second quarter.
From a fundamental perspective, the dollar's situation is both good and bad simultaneously. We believe the fundamentals support the dollar, but the market thinks otherwise. Let's explain the contradictions. Since the beginning of the year, the market has been expecting the Federal Reserve to lower its interest rate, and all this time, it has been preemptively responding to this event. The Fed has yet to begin monetary easing. However, market participants stir up the situation, making new, more and more unrealistic forecasts, which, in turn, are reflected by selling the dollar. The market expects almost a 1.5% rate cut by the end of the year, as it found the latest labor market and unemployment reports particularly disappointing.
If we look past the market's exaggerated expectations of a Fed rate cut (which Fed Chairman Jerome Powell has addressed on multiple occasions), the fundamentals support the dollar. The Fed maintains its rate at the peak value, and inflation remains above the target level, providing no basis for a rate cut. The US economy is also showing robust growth, often surpassing market expectations. Therefore, there is no sign of a recession, nor is one expected in the near future.
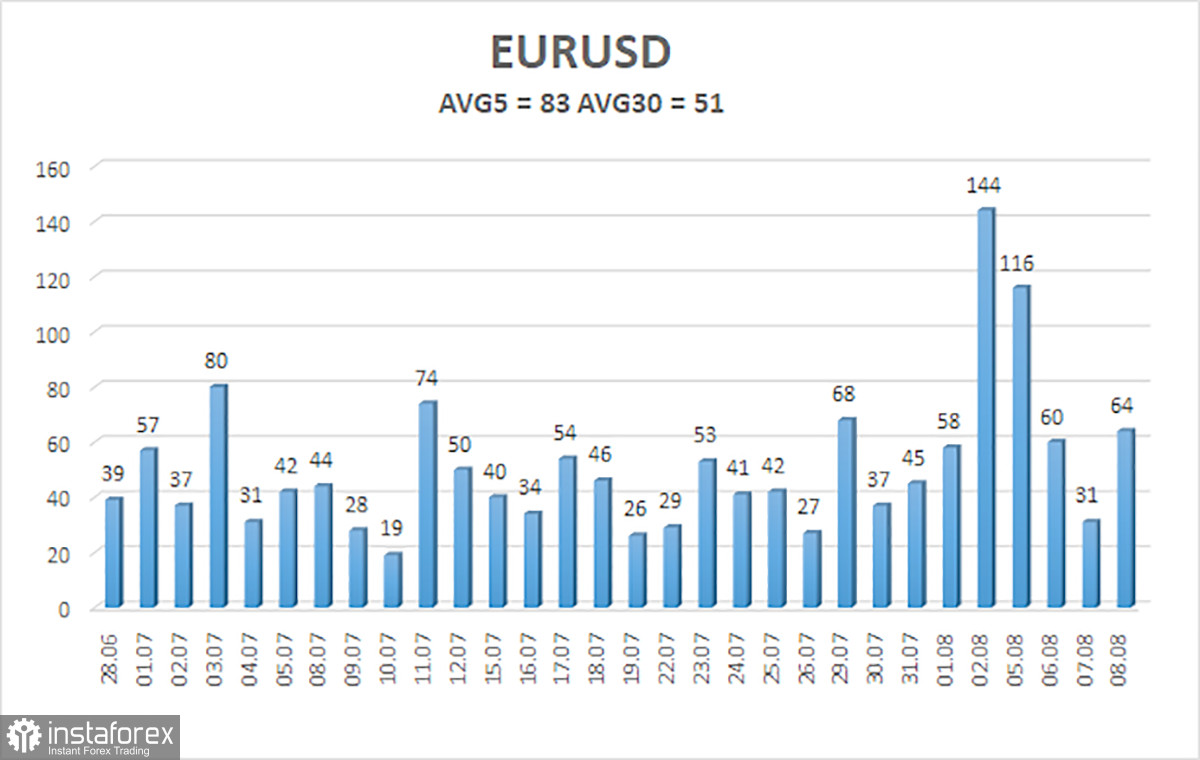
The average volatility of EUR/USD over the past five trading days as of August 9 is 83 pips, which is considered average. We expect the pair to move between the levels of 1.0825 and 1.0991 on Friday. The higher linear regression channel is directed upwards, but the global downward trend persists. The CCI indicator entered the overbought area for the second time, again warning of a potential shift to a downtrend.
Nearest Support Levels:
- S1 – 1.0864
- S2 – 1.0803
- S3 – 1.0742
Nearest Resistance Levels:
- R1 – 1.0925
- R2 – 1.0986
- R3 – 1.1047
Trading Recommendations:
The EUR/USD pair maintains a global downward trend and in the 4-hour time frame, it started a downward correction, which could mark the start of a new wave of the downtrend. In previous reviews, we mentioned that we are only expecting declines from the euro. We do not believe the euro can start a new global trend amid the European Central Bank's monetary policy easing, so the pair will likely fluctuate between 1.0600 and 1.1000 for some time. For now, it appears as though the price has bounced off the upper boundary of the horizontal channel and is heading towards the lower boundary.
Explanations for Illustrations:
Linear Regression Channels: help determine the current trend. If both are directed in the same direction, it means the trend is strong.
Moving Average Line (settings 20,0, smoothed): determines the short-term trend and the direction in which trading should be conducted.
Murray Levels: target levels for movements and corrections.
Volatility Levels (red lines): the probable price channel in which the pair will spend the next 24 hours, based on current volatility indicators.
CCI Indicator: Entering the oversold area (below 250) or the overbought area (above +250) means a trend reversal is approaching.