Analyzing Tuesday's trades:
EUR/USD on 1H chart
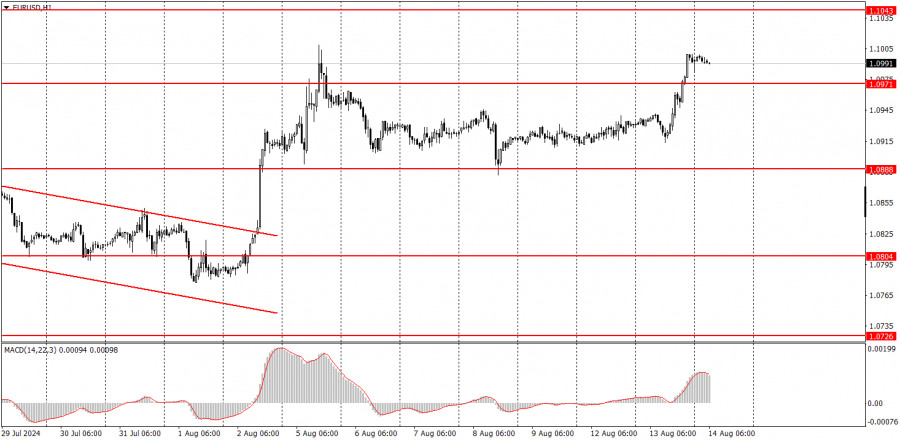
On Tuesday, the EUR/USD pair experienced a sharp and relatively strong upward movement. The market's reaction to yesterday's macroeconomic data could be included in a textbook chapter titled "How the Market Trades When It Is Biased Towards a Certain Direction." Essentially, the U.S. Producer Price Index triggered the entire upward movement. This indicator decelerated by 0.1% more than forecasts on an annual basis and was 0.1% below forecasts on a monthly basis. The market interpreted this information as a signal to immediately sell the dollar, as one of the inflation indicators had formally slowed down. Currently, any deceleration in U.S. inflation can trigger a dollar collapse since the market has been waiting for a Federal Reserve rate cut for seven months. We did not anticipate such a strong reaction to a routine report, but once again, the market demonstrated its readiness to use any formal reason to justify its expectations of a Fed rate cut in September. Nevertheless, the EUR/USD pair remains within the horizontal channel of 1.0600–1.1000.
EUR/USD on 5M chart
On Tuesday, several trading signals were formed in the 5-minute time frame, and the movement was quite favorable. The first sell signal around the 1.0940 level was false, but the trade could have been closed at break-even as the price moved in the intended direction by more than 15 pips. Then, a buy signal was formed around the same level of 1.0940, which generated a profit. The price subsequently reached the 10th level, where profits could be manually realized.
Trading tips on Wednesday:
EUR/USD broke the short-term downward trend in the hourly time frame but has yet to exceed the 1.10 level. We believe the euro has fully factored in all the bullish factors, so we do not expect sustained upward movement. A flat trend persists within the 1.06-1.10 range in the 24-hour time frame. However, the market continues to demonstrate that any deceleration in U.S. inflation prompts panic selling of the dollar. The inflation report will be released today.
On Wednesday, novice traders may anticipate a downward reversal as the price is once again near the upper boundary of the horizontal channel at 1.0600–1.1000. However, today's U.S. inflation report could easily trigger a new drop in the dollar.
The key levels to consider on the 5M time frame are 1.0526, 1.0568, 1.0611, 1.0678, 1.0726–1.0733, 1.0797–1.0804, 1.0838–1.0856, 1.0888–1.0896, 1.0940, 1.0971, 1.1011, 1.1043, and 1.1091. On Wednesday, the Eurozone is scheduled to release reports on GDP for the second quarter and industrial production. However, these data can be considered secondary compared to the U.S. inflation report.
Basic rules of the trading system:
1) The strength of a signal is determined by the time it took for the signal to form (bounce or level breakthrough). The shorter the time required, the stronger the signal.
2) If two or more trades around a certain level are initiated based on false signals, subsequent signals from that level should be ignored.
3) In a flat market, any currency pair can produce multiple false signals or none at all. In any case, it's better to stop trading at the first signs of a flat market.
4) Trades should be opened between the start of the European session and mid-way through the U.S. session. All trades must be closed manually after this period.
5) In the hourly time frame, trades based on MACD signals are only advisable amidst substantial volatility and an established trend, confirmed either by a trendline or trend channel.
6) If two levels are too close to each other (from 5 to 20 pips), they should be considered as a support or resistance zone.
7) After moving 15 pips in the intended direction, the Stop Loss should be set to break-even.
What's on the charts:
Support and Resistance price levels: targets when opening long or short positions. You can place Take Profit levels near them.
Red lines represent channels or trend lines that depict the current trend and indicate the preferred trading direction.
The MACD (14,22,3) indicator, encompassing both the histogram and signal line, acts as an auxiliary tool and can also be used as a source of signals.
Important speeches and reports (always noted in the news calendar) can profoundly influence the price dynamics. Hence, trading during their release calls for heightened caution. It may be reasonable to exit the market to prevent abrupt price reversals against the prevailing trend.
Beginners should always remember that not every trade will yield profit. Establishing a clear strategy, coupled with effective money management, is key to long-term success in trading.


