Analyzing Thursday's trades:
EUR/USD on 1H chart
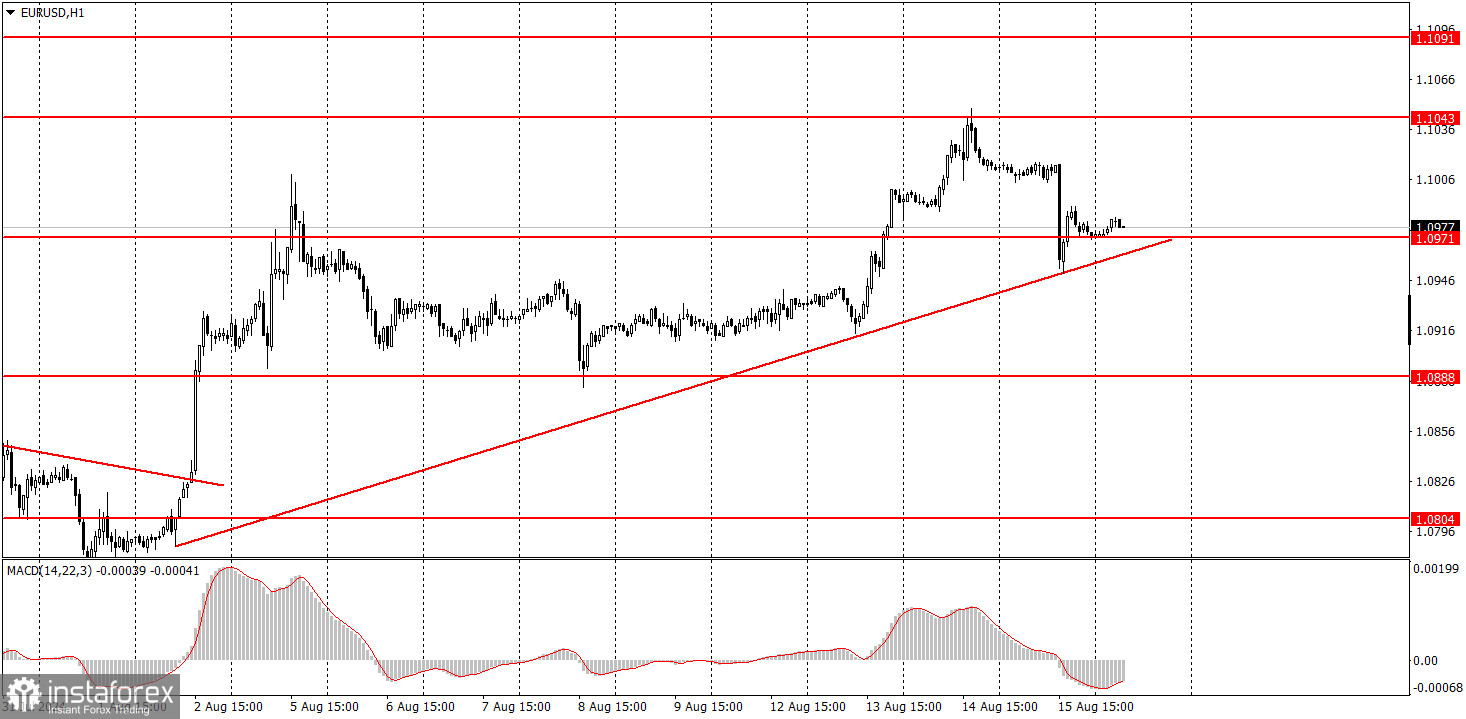
The EUR/USD pair sharply and powerfully dropped at the beginning of the U.S. trading session on Thursday and reached an ascending trend line in the hourly time frame. The rebound from this line was neither significant nor rapid, so the market will likely retest this line today with a potential for a further breakthrough. We have repeatedly noted that the euro appears significantly overbought, and the market constantly uses any formal reasons to sell the dollar. Just this week, two rather mediocre inflation reports from the U.S. triggered another decline in the dollar. However, the pair remains globally within the horizontal channel of 1.0600-1.1000. Yes, there was a breakout this week—the price rose above 1.1000. But again, globally, this hasn't changed anything yet. For further growth, the euro needs "fuel," and the "fuel" is of rather poor quality given the European Central Bank's rate cuts and the market's repeated pricing in of the Federal Reserve's monetary policy easing, which hasn't even started yet.
EUR/USD on 5M chart
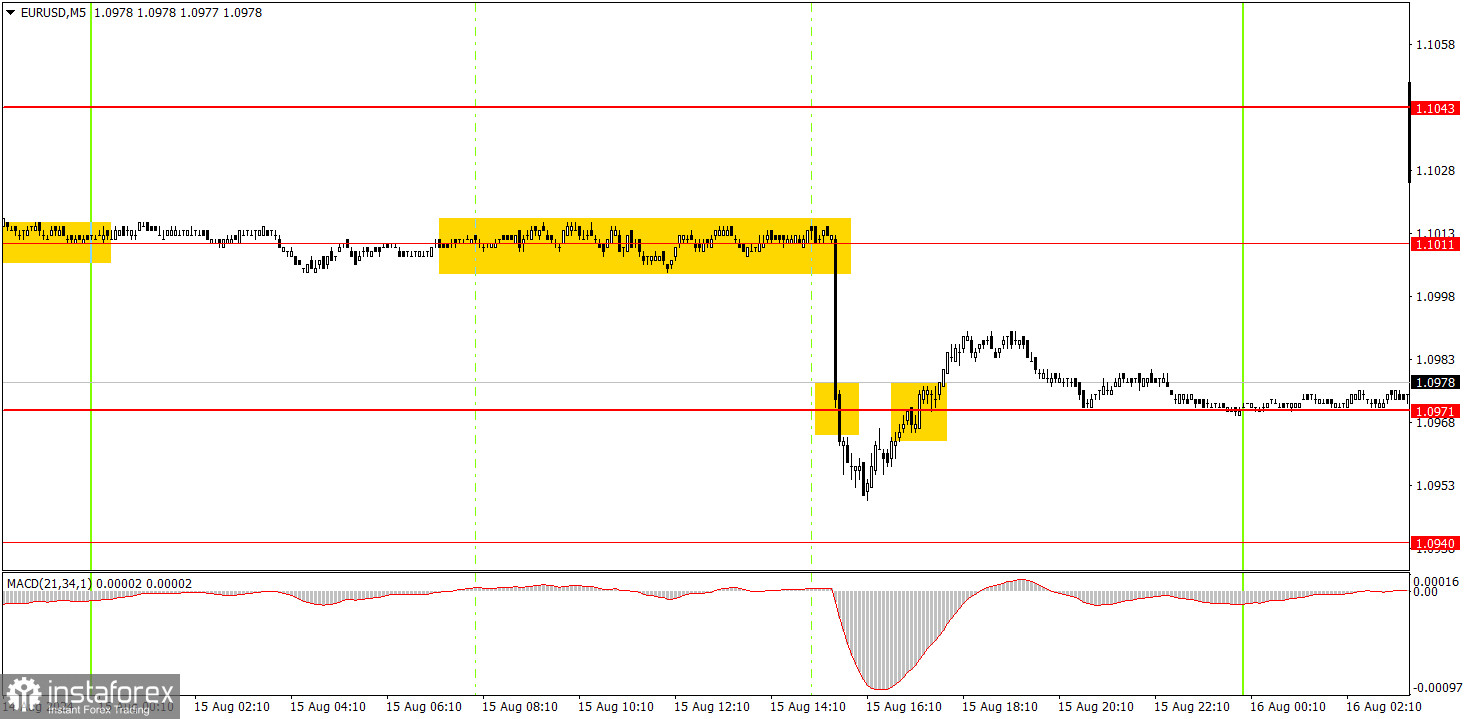
In the 5-minute time frame, several trading signals were generated on Thursday. There was no way to process the first sell signal near the level of 1.1013 since the US retail sales report came out, and the price immediately fell. Along the way, it overcame the level of 1.0971 but could not continue falling further. The last trading signal to buy was formed in the middle of the upward pullback and closer to the evening. It was hardly worth working out.
Trading tips on Friday:
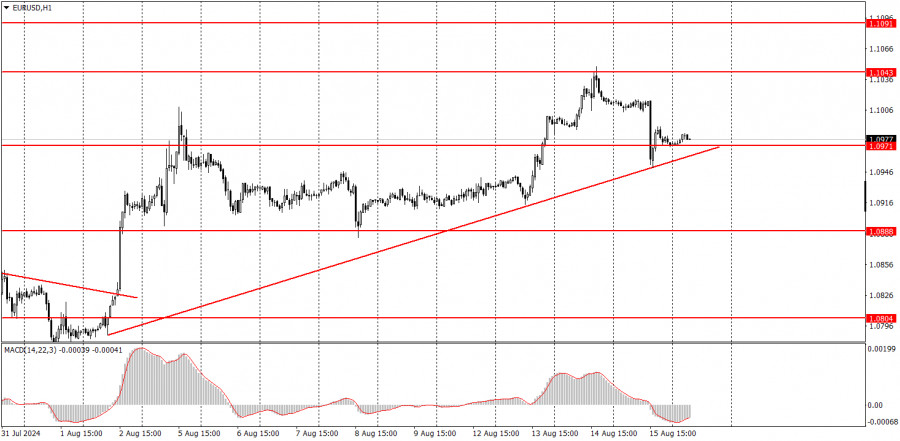
EUR/USD has formed a new upward trend supported by a trend line in the hourly time frame. We believe the euro has fully factored in all the bullish factors, so we do not expect sustained upward movement. The flat phase remains within the 1.06-1.10 range in the 24-hour time frame. However, the market again shows that it is ready to deal with any U.S. inflation slowdown by panic selling the dollar. Therefore, while expectations are one thing, the current technical picture should not be ignored. The pair can be expected to fall after consolidating below the trendline.
If the price consolidates below the trendline on Friday, novice traders should be prepared for a potential fall. In this case, the euro could drop to 1.0888.
The key levels to consider on the 5M time frame are 1.0526, 1.0568, 1.0611, 1.0678, 1.0726-1.0733, 1.0797-1.0804, 1.0838-1.0856, 1.0888-1.0896, 1.0940, 1.0971, 1.1011, 1.1043, and 1.1091. No significant events are scheduled for Friday in the Eurozone, while in the U.S., reports of medium significance will be released—University of Michigan's Consumer Sentiment Index and approved building permits.
Basic rules of the trading system:
1) The strength of a signal is determined by the time it took for the signal to form (bounce or level breakthrough). The shorter the time required, the stronger the signal.
2) If two or more trades around a certain level are initiated based on false signals, subsequent signals from that level should be ignored.
3) In a flat market, any currency pair can produce multiple false signals or none at all. In any case, it's better to stop trading at the first signs of a flat market.
4) Trades should be opened between the start of the European session and mid-way through the U.S. session. All trades must be closed manually after this period.
5) In the hourly time frame, trades based on MACD signals are only advisable amidst substantial volatility and an established trend, confirmed either by a trendline or trend channel.
6) If two levels are too close to each other (from 5 to 20 pips), they should be considered as a support or resistance zone.
7) After moving 15 pips in the intended direction, the Stop Loss should be set to break-even.
What's on the charts:
Support and Resistance price levels: targets when opening long or short positions. You can place Take Profit levels near them.
Red lines: channels or trend lines that depict the current trend and indicate the preferred trading direction.
The MACD (14,22,3) indicator, encompassing both the histogram and signal line, acts as an auxiliary tool and can also be used as a source of signals.
Important speeches and reports (always noted in the news calendar) can profoundly influence the price dynamics. Hence, trading during their release calls for heightened caution. It may be reasonable to exit the market to prevent abrupt price reversals against the prevailing trend.
Beginners should always remember that not every trade will yield profit. Establishing a clear strategy, coupled with effective money management, is key to long-term success in trading.