Analyzing Wednesday's Trades:
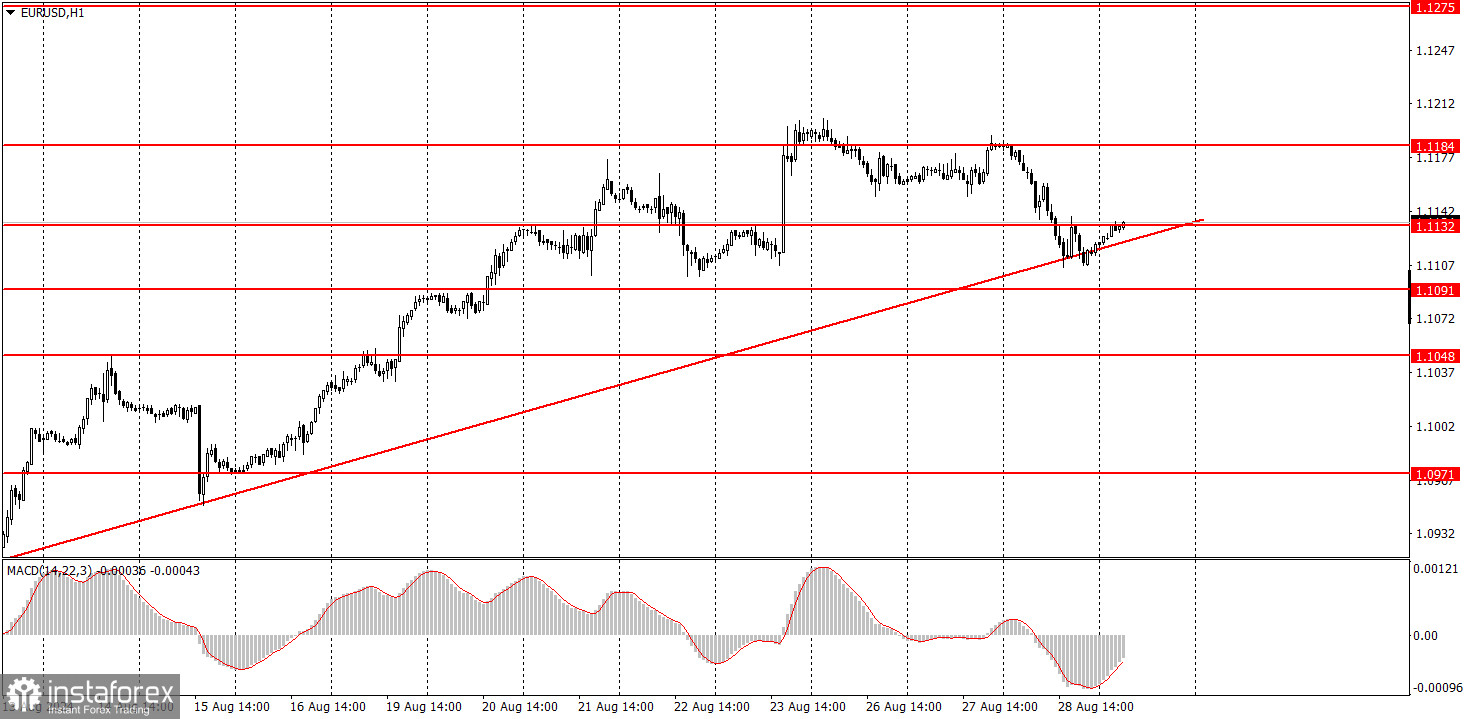
EUR/USD on 1H Chart
On Wednesday, the EUR/USD pair experienced a slight downward correction but failed to break through the ascending trend line or even surpass the last local low. Therefore, the current correction is considered "minor." It's worth noting that there were no macroeconomic or fundamental events yesterday, so the decline was purely technical. This does not necessarily mean that a new downward trend, which many are anticipating, will begin. The euro continues to rise with or without reason, and the dollar continues to fall for the same reasons. Of course, if the price consolidates below the trend line, it would significantly increase the likelihood of a decline in the pair. However, we remind you that we have only seen growth over the past three weeks based on market expectations for an FOMC rate cut in September. The market has plenty of time until September 18 to work out this factor. If we receive disappointing labor market and unemployment data from the US next week, the dollar's decline could even accelerate.
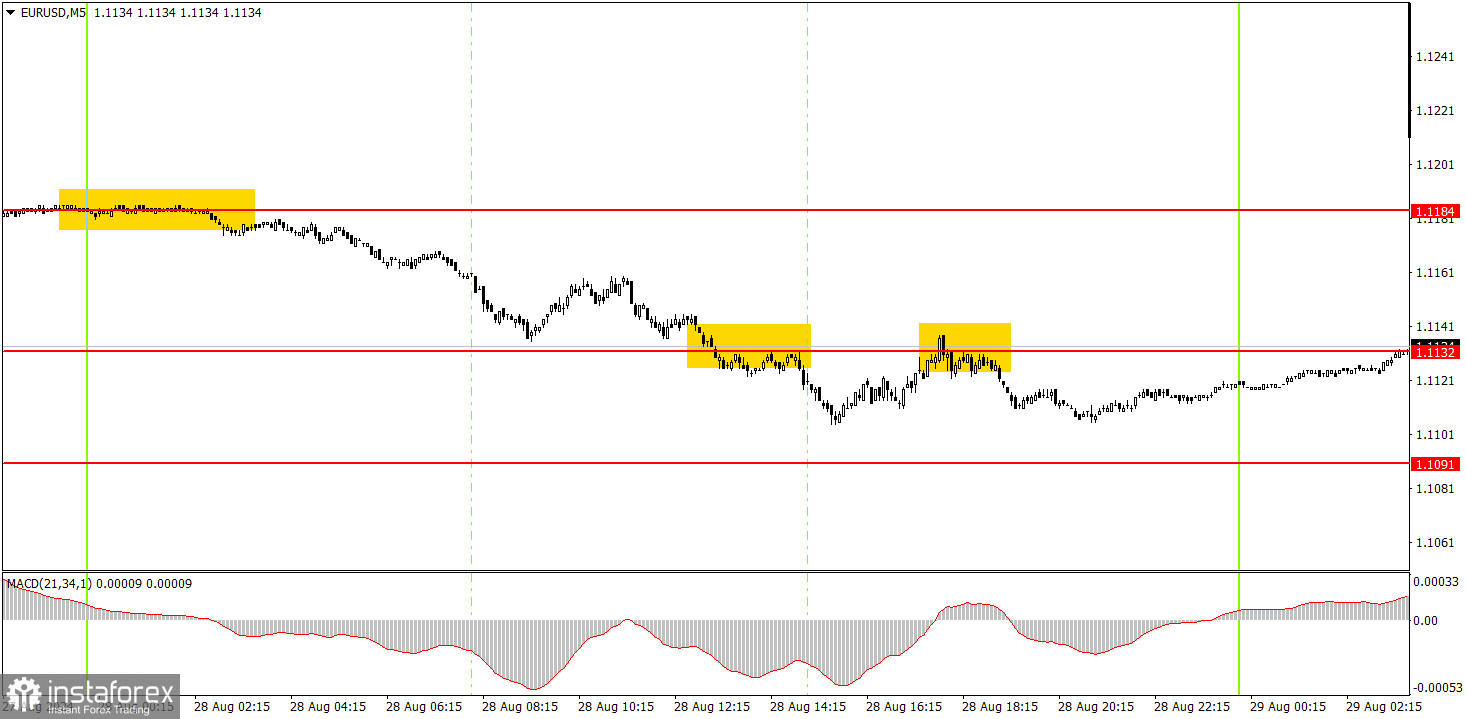
EUR/USD on 5M Chart
Three trading signals were generated in the 5-minute time frame on Wednesday. The first sell signal near the 1.1184 level was formed overnight and was unlikely to be executed. To form the next signal, we had to wait for consolidation below the level of 1.1137. It was later confirmed with a bounce from the same level. However, the nearest target of 1.1091 was not reached, and the price returned to the 1.1137 level for the second time during the night.
How to Trade on Thursday:
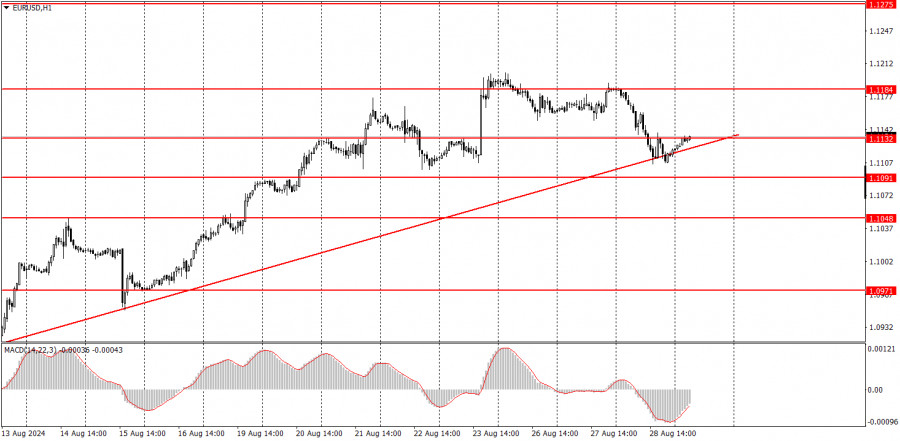
EUR/USD continues to form an upward trend supported by a trend line in the hourly time frame. We believe the euro has already addressed all the bullish factors, so we do not expect further upward movement. However, the market again shows it is ready to react to almost any event with panic dollar sell-offs. And even if there are no events, it is still prepared to sell the dollar for no reason. We can expect a noticeable drop in the pair after consolidation below the trend line.
On Thursday, novice traders might anticipate another decline if the price bounces off the 1.1137 level again.
The key levels to consider on the 5M time frame are 1.0726-1.0733, 1.0797-1.0804, 1.0838-1.0856, 1.0888-1.0896, 1.0940, 1.0971, 1.1011, 1.1048, 1.1091, 1.1132, 1.1184, and 1.1275-1.1292. On Thursday, inflation data from Germany is scheduled for release in the Eurozone, and in the US, the second estimate of GDP for the second quarter will be published. As we recall, the market tends to ignore all positive reports from the US with pleasure. However, a decline is possible today if the trend line is breached.
Basic Rules of the Trading System:
1) The strength of a signal is determined by the time it takes for the signal to form (bounce or level breakthrough). The less time it took, the stronger the signal.
2) If two or more trades around a certain level are initiated based on false signals, subsequent signals from that level should be ignored.
3) In a flat market, any currency pair can form multiple false signals or none at all. In any case, it's better to stop trading at the first signs of a flat market.
4) Trades should be opened between the start of the European session and midway through the U.S. session. After this period, all trades must be closed manually.
5) In the hourly time frame, trades based on MACD signals are only advisable amidst substantial volatility and an established trend confirmed by a trendline or trend channel.
6) If two levels are too close to each other (5 to 20 pips), they should be considered support or resistance.
7) After moving 15 pips in the intended direction, the Stop Loss should be set to break even.
What's on the Charts:
Support and Resistance price levels: targets for opening long or short positions. You can place Take Profit levels near them.
Red lines: channels or trend lines that depict the current trend and indicate the preferred trading direction.
The MACD (14,22,3) indicator, encompassing both the histogram and signal line, acts as an auxiliary tool and can also be used as a source of signals.
Important speeches and reports (always noted in the news calendar) can profoundly influence the movement of a currency pair. Hence, trading during their release calls for heightened caution. It may be reasonable to exit the market to prevent abrupt price reversals against the prevailing trend.
Beginners should always remember that not every trade will yield profit. Developing a clear strategy and effective money management is key to success in trading over a long period.