Analyzing Thursday's Trades:
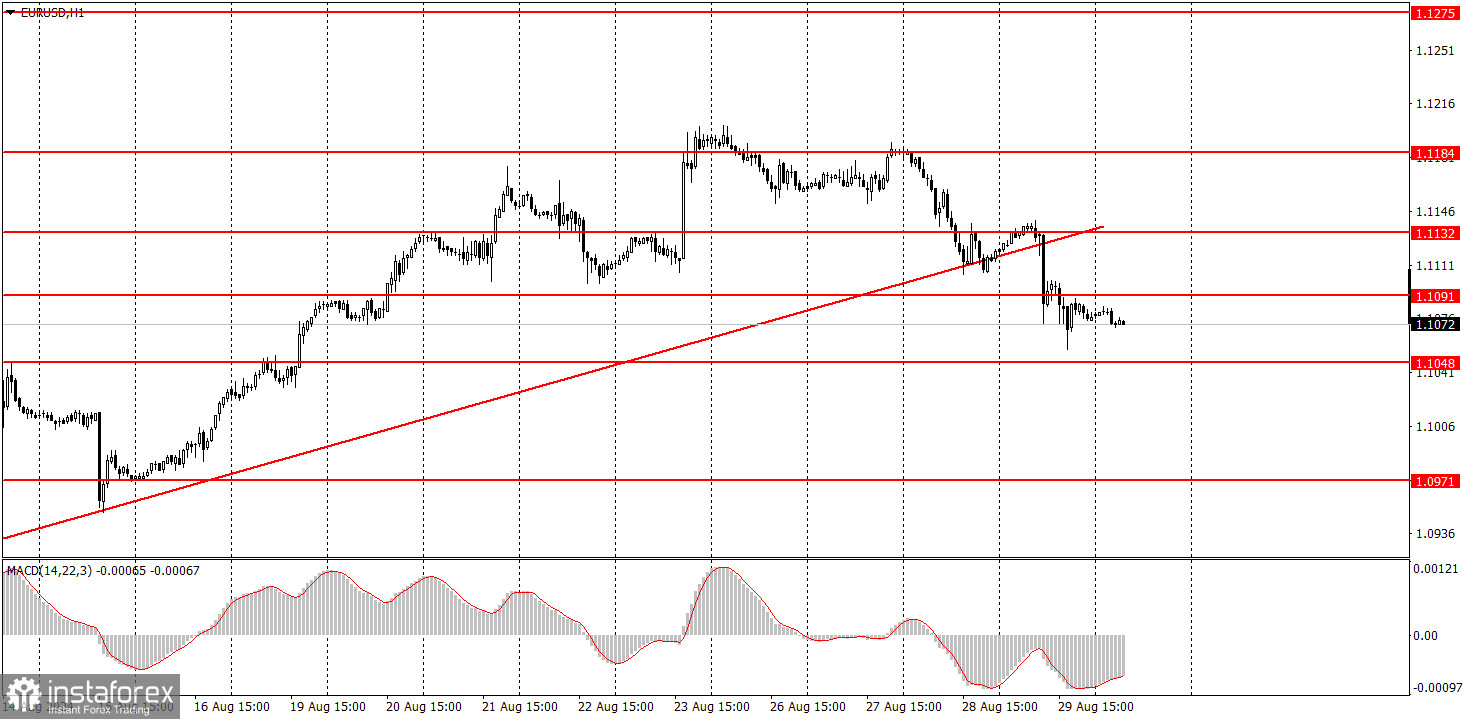
EUR/USD on 1H Chart
The EUR/USD pair sustained its downward movement on Thursday and finally consolidated below the ascending trend line. The pair's movements this week are quite encouraging. The euro has finally started to decline, and the market has finally begun to pay attention to positive reports from the US. They also suddenly realized that the European Central Bank might lower rates for the second time in September. Yesterday, it was revealed that inflation in Germany had already slowed to 1.9%, and today, European inflation may also show a significant slowdown. With such inflation levels, the ECB has little reason to keep rates unchanged in September. Even without a potential rate cut in the Eurozone, the dollar should rise, and the euro should fall. The euro is heavily overbought, while the dollar is undervalued. If the market has been pricing in a Federal Reserve rate cut throughout 2024, which has yet to materialize, the dollar has already considered this factor. We still cannot predict further growth for the euro.
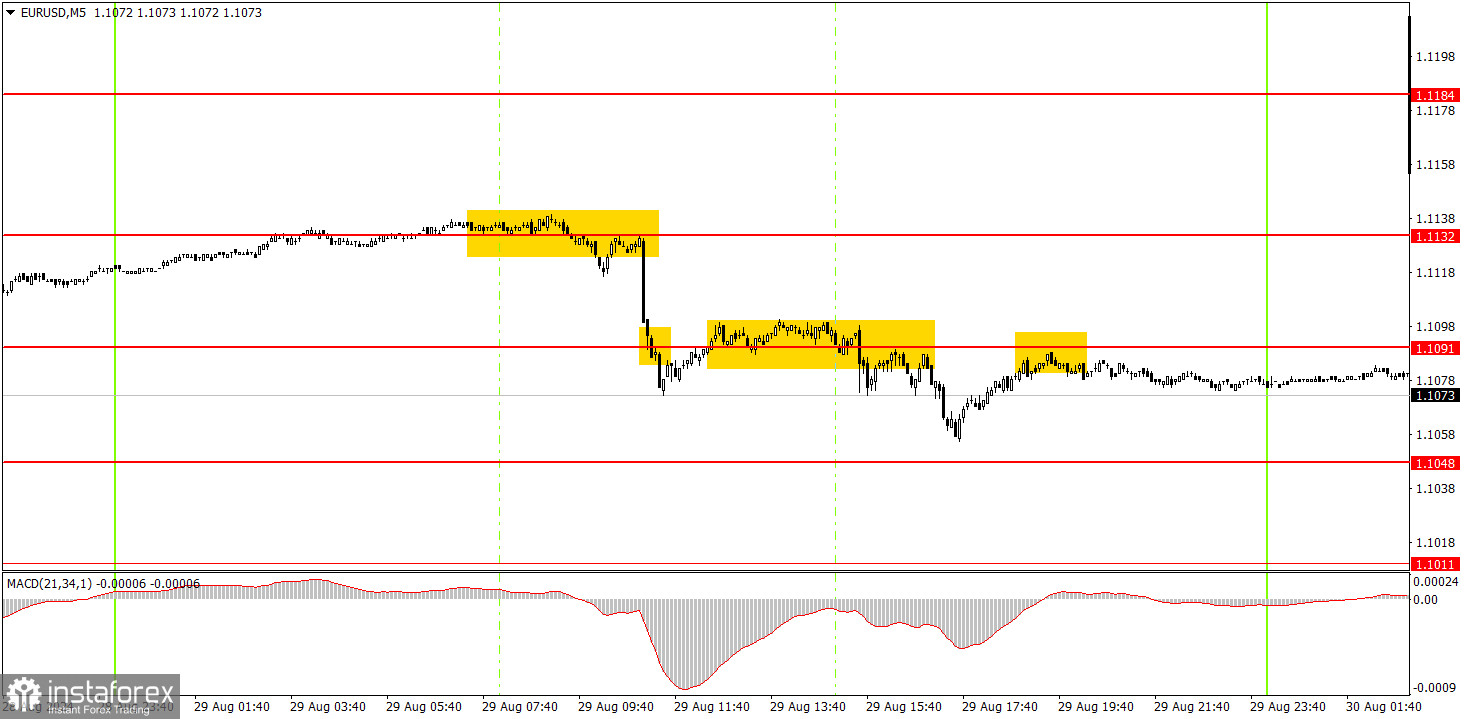
EUR/USD on 5M Chart
Several trading signals were formed in the 5-minute time frame on Thursday. Initially, the pair settled below the 1.1132 level and fell below the 1.1091 level. For the most part, it remained below this level for the rest of the day, so the only short position could be held until the evening and closed manually. There was a 3-hour period when the price traded around the 1.1091 level, but the consolidation above it was neither deep nor confident.
How to Trade on Friday:
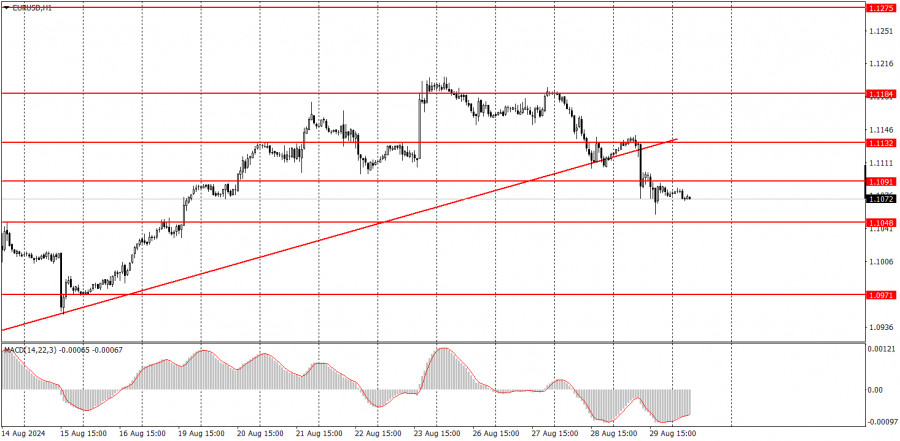
In the hourly time frame, the EUR/USD pair has settled below the ascending trend line and, for the first time in a long while, has a chance to form a downward trend that would be logical and consistent with all factors and types of analysis. Unfortunately, illogical dollar sales could quickly resume after a downward correction, as no one knows how long the market will continue to price in the Fed's monetary policy easing, which has yet to start. However, the fact remains that the market continues to price in nearly all future Fed rate cuts into the dollar.
On Friday, novice traders might again expect a decline, as the price has settled below the 1.1091 level. We remain skeptical about buying.
The key levels to consider on the 5M time frame are 1.0726-1.0733, 1.0797-1.0804, 1.0838-1.0856, 1.0888-1.0896, 1.0940, 1.0971, 1.1011, 1.1048, 1.1091, 1.1132, 1.1184, 1.1275-1.1292. On Friday, the Eurozone will release inflation reports, Germany will release unemployment and retail sales reports, and the US will release personal consumption expenditure price indexes and consumer sentiment indices. All these reports could provoke some market reaction.
Basic Rules of the Trading System:
1) The strength of a signal is determined by the time it takes for the signal to form (bounce or level breakthrough). The less time it took, the stronger the signal.
2) If two or more trades around a certain level are initiated based on false signals, subsequent signals from that level should be ignored.
3) In a flat market, any currency pair can form multiple false signals or none at all. In any case, it's better to stop trading at the first signs of a flat market.
4) Trades should be opened between the start of the European session and midway through the U.S. session. After this period, all trades must be closed manually.
5) In the hourly time frame, trades based on MACD signals are only advisable amidst substantial volatility and an established trend confirmed by a trendline or trend channel.
6) If two levels are too close to each other (5 to 20 pips), they should be considered support or resistance.
7) After moving 15 pips in the intended direction, the Stop Loss should be set to break even.
What's on the Charts:
Support and Resistance price levels: targets for opening long or short positions. You can place Take Profit levels near them.
Red lines: channels or trend lines that depict the current trend and indicate the preferred trading direction.
The MACD (14,22,3) indicator, encompassing both the histogram and signal line, acts as an auxiliary tool and can also be used as a source of signals.
Important speeches and reports (always noted in the news calendar) can profoundly influence the movement of a currency pair. Hence, trading during their release calls for heightened caution. It may be reasonable to exit the market to prevent abrupt price reversals against the prevailing trend.
Beginners should always remember that not every trade will yield profit. Developing a clear strategy and effective money management is key to success in trading over a long period.