Analyzing Tuesday's Trades:
GBP/USD on 1H Chart
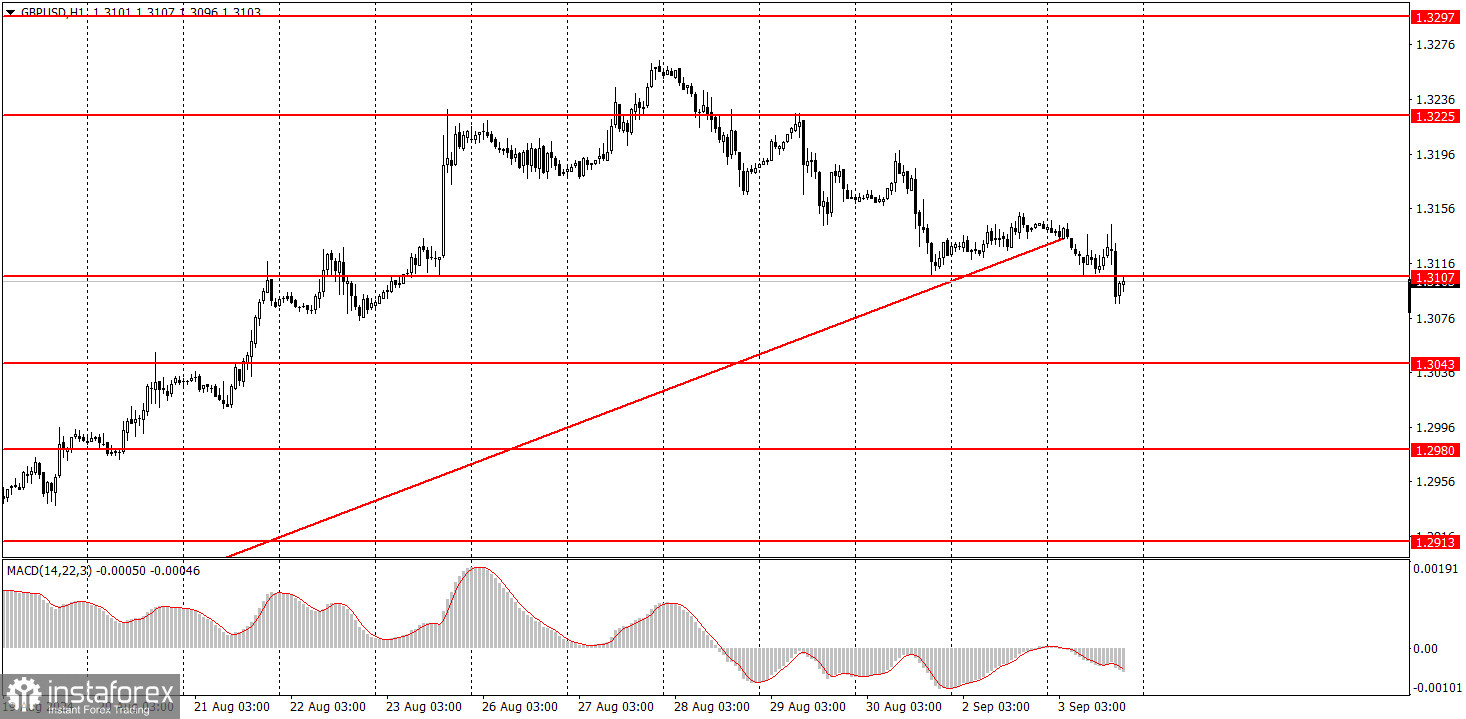
On Tuesday, the GBP/USD pair sustained its sluggish downward movement, but traders should be pleased even with this modest decline of the British pound. In recent months, it has rarely given us the satisfaction of a drop. As we mentioned earlier, the only report of the day from the U.S. turned out to be rather mediocre, so it's unlikely that it was the primary driver behind the strengthening of the U.S. dollar. Moreover, the timing of the pair's decline doesn't align with the report's release. However, it can be assumed that the S&P and ISM business activity indices provided a basis for some small dollar purchases.
As a result, the pair has more confidently settled below the ascending trendline, so further decline can be expected. Plenty of U.S. reports this week could easily stop the pair's decline. In any case, we certainly don't anticipate a collapse.
GBP/USD on 5M Chart
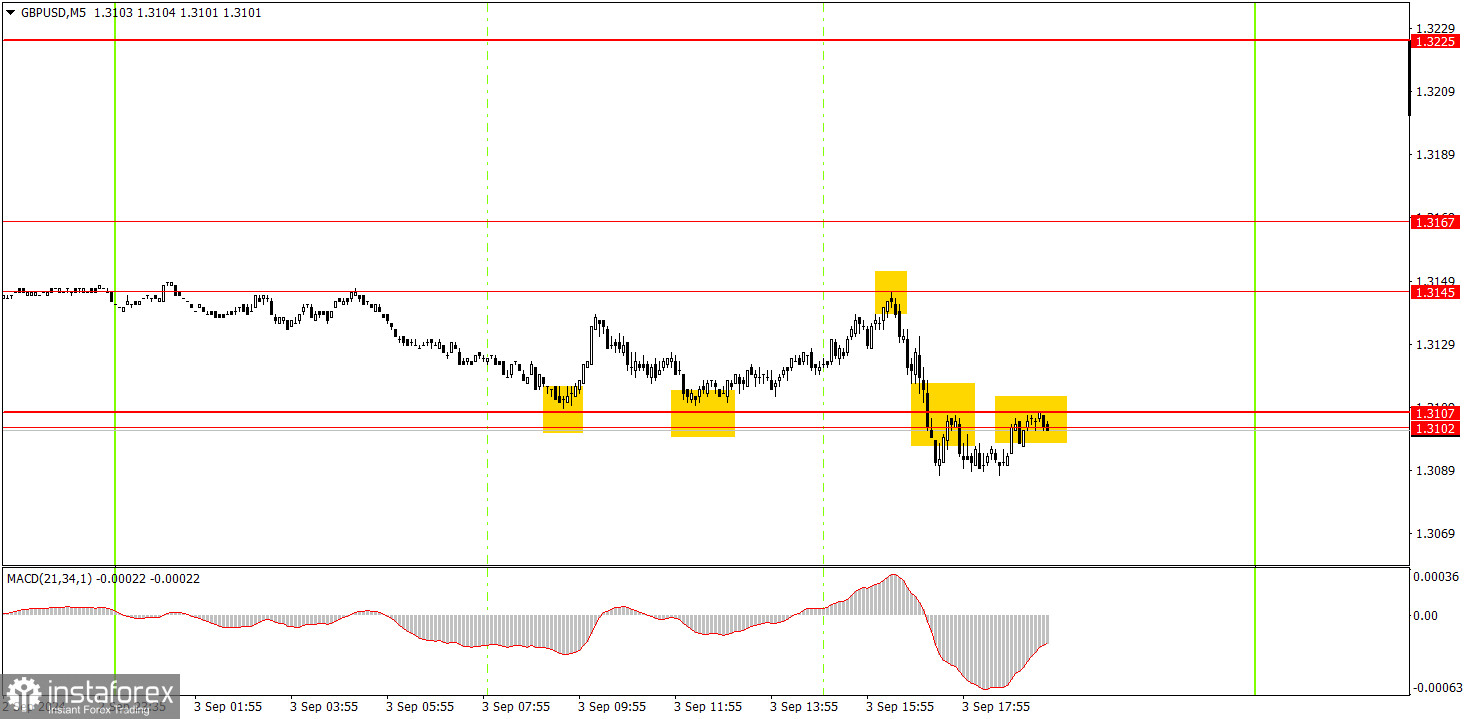
Several good signals were formed in the 5-minute time frame on Tuesday. First, during the European trading session, the price bounced twice from the 1.3107 level, after which it managed to rise to the 1.3145 level and bounce off it perfectly. Thus, you could have earned about 15-20 pips on the long position. The bounce from the 1.3145 level could also have been traded, and the price eventually managed to settle below the 1.3102-1.3107 area, where short positions should have been closed or carried over to Wednesday.
How to Trade on Wednesday:
In the hourly time frame, GBP/USD has a good chance of resuming the global downward trend or at least experiencing some decline. The British pound remains overbought, the dollar is undervalued, and the market continues to use every opportunity to buy the British currency and sell the dollar. So far, the pound is only showing a minor bearish correction, and it's too early to talk about a full-fledged downtrend.
On Wednesday, the pair may continue moving downward since the trendline has been breached, as well as the relatively important area of 1.3102-1.3107. If the price doesn't recover above this area overnight or in the morning, staying in short positions is advisable.
The key levels to consider on the 5M timeframe are 1.2605-1.2633, 1.2684-1.2693, 1.2748, 1.2791-1.2798, 1.2848-1.2860, 1.2913, 1.2980-1.2993, 1.3043, 1.3102-1.3107, 1.3145-1.3167, 1.3225, 1.3272, and 1.3310. On Wednesday, the UK will release a minor report on business activity in the services sector for August in its second estimate. In the U.S., a more significant JOLTs report on job openings will be published. However, a strong market reaction is not expected in either case.
Basic Rules of the Trading System:
1) The strength of a signal is determined by the time it takes for the signal to form (bounce or level breakthrough). The less time it took, the stronger the signal.
2) If two or more trades around a certain level are initiated based on false signals, subsequent signals from that level should be ignored.
3) In a flat market, any currency pair can form multiple false signals or none at all. In any case, it's better to stop trading at the first signs of a flat market.
4) Trades should be opened between the start of the European session and midway through the U.S. session. After this period, all trades must be closed manually.
5) In the hourly time frame, trades based on MACD signals are only advisable amidst substantial volatility and an established trend confirmed by a trendline or trend channel.
6) If two levels are too close to each other (5 to 20 pips), they should be considered support or resistance.
7) After moving 20 pips in the intended direction, the Stop Loss should be set to break even.
What's on the Charts:
Support and Resistance price levels: targets for opening long or short positions. You can place Take Profit levels near them.
Red lines: channels or trend lines that depict the current trend and indicate the preferred trading direction.
The MACD (14,22,3) indicator, encompassing both the histogram and signal line, acts as an auxiliary tool and can also be used as a source of signals.
Important speeches and reports (always noted in the news calendar) can profoundly influence the movement of a currency pair. Hence, trading during their release calls for heightened caution. It may be reasonable to exit the market to prevent abrupt price reversals against the prevailing trend.
Beginners should always remember that not every trade will yield profit. Developing a clear strategy and effective money management is key to success in trading over a long period.