In my morning forecast, I focused on the level of 1.3083 and planned to make trading decisions based on it. Let's look at the 5-minute chart and analyze what happened. A decline and a false breakout at that level resulted in a buying opportunity for the pound, leading to an upward move of only 15 points. The technical outlook was revised for the second half of the day.
To open long positions on GBP/USD:
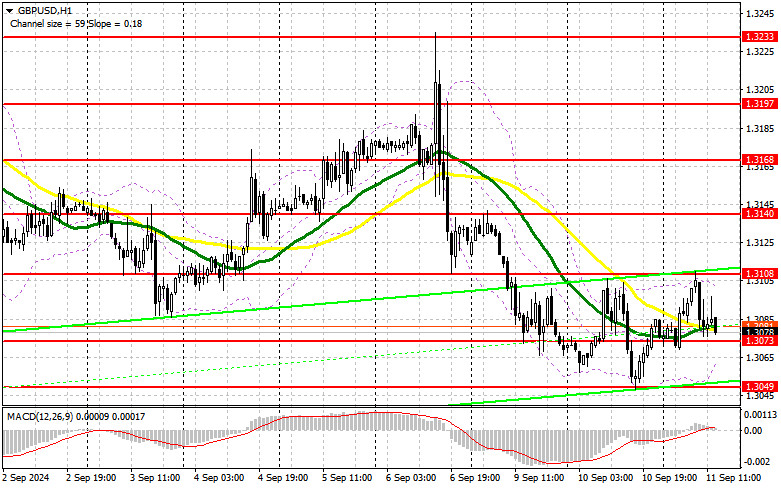
Weak data showing a slowdown in the UK's GDP growth, specifically the lack of positive dynamics in July this year, put pressure on the pound, so it's no surprise that buyers were not particularly active around 1.3083. In the second half of the day, the U.S. Consumer Price Index (CPI) data for August is expected, which could trigger volatility. A sharp decline in inflation would allow the pound to regain momentum, which in turn could cause the dollar to fall. If inflation matches economists' forecasts, or rises, pressure on GBP/USD will likely increase. In the event of a negative market reaction to the statistics, I would prefer to return to long positions only after a decline and the formation of a false breakout around the new interim support at 1.3073. This would provide a chance for a correction and a recovery to 1.3108. A breakout and consolidation above this range amid declining U.S. inflation will increase the chances of an intraday uptrend. This will lead to the removal of sellers' stop orders and provide a good entry point for long positions with a target of 1.3140. The final target will be around 1.3168, where I will take profits. In the scenario of a decline in GBP/USD and a lack of activity from buyers at 1.3073 in the second half of the day, pressure on the pair will increase. This will also lead to a decline and a retest of the next support at 1.3049, which would nullify buyers' plans. Only a false breakout at this level will provide a good opportunity to open long positions. I plan to buy GBP/USD on a rebound from the 1.3012 low with a target of a 30-35 point intraday correction.
To open short positions on GBP/USD:
Sellers made an attempt but haven't fully taken control of the market yet. American statistics and the defense of the nearest resistance at 1.3108 could help with this. A false breakout at this level, similar to the scenario mentioned above, would provide a good opportunity to open new short positions, continuing the trend and targeting support at 1.3073, where the moving averages, currently supportive of bullish momentum, are located. A breakout and retest from below upwards of this range will hit buyers' positions, leading to the removal of stop orders and opening the path to 1.3049, where I expect more active action from major players. The final target will be around 1.3012, where I will take profits. In the event of a rise in GBP/USD and no significant activity at 1.3108 in the second half of the day, buyers may attempt to consolidate the pair within a sideways channel. Bears will then likely have to pull back to the resistance area of 1.3140. I will sell there only on a false breakout. If there is no downward movement from there, I will look for short positions on a rebound around 1.3168, expecting a downward correction of the pair by 30-35 points.
In the COT (Commitment of Traders) report for September 3, long positions increased, and short positions decreased. It is clear that despite the pair's correction, traders are confident that a rate cut in the U.S. is a more significant event than similar actions from the Bank of England. Most likely, the market is currently pricing in future borrowing cost reductions in the UK, and demand for the pound will return soon as the medium-term uptrend remains intact. The fact that there are three times as many long positions as short ones speaks for itself. The latest COT report shows that long non-commercial positions jumped by 8,610 to 160,773, while short non-commercial positions decreased by 9,537 to 52,695. As a result, the gap between long and short positions fell by 342.
Indicator signals:
Moving averages:
Trading is taking place around the 30- and 50-day moving averages, indicating a sideways market.
Note: The periods and prices of the moving averages are considered by the author on the hourly H1 chart and differ from the definition of classical daily moving averages on the daily D1 chart.
Bollinger Bands:
In the event of a decline, the lower boundary of the indicator around 1.3050 will act as support.
Indicator descriptions:
- Moving Average (MA): Determines the current trend by smoothing volatility and noise. Period 50 is marked in yellow on the chart.
- Moving Average (MA): Determines the current trend by smoothing volatility and noise. Period 30 is marked in green on the chart.
- MACD indicator (Moving Average Convergence/Divergence): Fast EMA period 12, Slow EMA period 26, SMA period 9.
- Bollinger Bands: Period 20.
- Non-commercial traders: Speculators such as individual traders, hedge funds, and large institutions using the futures market for speculative purposes and meeting certain requirements.
- Long non-commercial positions: Represent the total long open positions of non-commercial traders.
- Short non-commercial positions: Represent the total short open positions of non-commercial traders.
- Total non-commercial net position: The difference between short and long positions of non-commercial traders.


